"A process of monitoring both internal and external changes which will ensure company awareness and assist in the prediction of future trends. It matches company capabilities with the wants of the customer and isolates restraining influences."
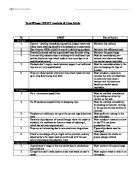
SWOT analysis can be a very useful way of summarising many of the other analyses and combining them with the key issues from environmental analysis. The aim is to identify the extent to which the current strategy of an organisation and it's more specific strengths and weaknesses are relevant to and capable of dealing with, the changes taking place in the business environment.
This simple technique provides a method of organising information in identifying possible strategic direction. The basic principle of SWOT analysis is that any statement about an organisation or its environment can be classified as follows (hover pointer over diagram for annotations):
A Weakness...
is simply any aspect of the company which may hinder the achievement of specific objectives such as limited experience of certain markets/technologies, extent of financial resources available.
This information would typically be presented as a matrix of strengths, weaknesses, opportunities and threats. There are several points to note about about presentation and interpretation:
* effective SWOT analysis does not simply require a categorisation of information, it also requires some evaluation of the relative importance of the various factors under consideration.
* these features are only of relevance if they are perceived to exist by the consumers.
* listing corporate feature that internal personnel regard as strengths/weaknesses is of little relevance if they are not perceived as such by the organisation's consumers.
* threats and opportunities are conditions presented by the external environment and they should be independent of the firm.
Having constructed a matrix of strengths, weaknesses, opportunities and threats with some evaluation attached to them, it then becomes feasible to make use of that matrix in guiding strategy formulation. The two major strategic options are as follows:
(a) Matching
This entails finding, where possible, a match between the strengths of the organisation and the opportunities presented by the market. Strengths which do not match any available opportunity are of limited use while opportunities which do not have any matching strengths are of little immediate value from a strategic perspective.
(b) Conversion
This requires the development of strategies which will convert weaknesses into strengths in order to take advantage of some particular opportunity, or converting threats into opportunities which can then be matched by existing strengths.
Although SWOT provides some guidance on developing a match between the organisation's environment and it's strategic direction, it is also necessary to consider more specific aspects of strategies such as how best to compete, how to grow within the target markets etc. To aid this process there are a number of analytical techniques which can be used; the role of these techniques is not to offer definitive statements on the final form that a strategy should take, but rather to provide a framework for the organisation and analysis of ideas and information. No one technique can always provide the most appropriate framework and those discussed below can and should be regarded as complementary rather than competitive.
Top of Form
Bottom of Form
Home > About Ericsson > Company facts > Financial information
About Ericsson
Mission & vision
Company facts
Board of directors
Management
Organization
Employees
Financial information
Publications
Glossary
Subscribe/unsubscribe
to press releases
Ericsson Worldwide
US/Canada
Europe
Asia Pacific
Latin America
Africa/Middle East
All countries
Key financial highlights
Financial results
Share performance
R380e - smarter than ever
Resources
Financial reports and share information for investors
Last published May 02, 2002
Contact
Legal
Privacy
ON magazine
Ericsson's customer magazine "On - The New World of Communication" covers trends and news within the converged telecom, datacom and media world. It is distributed to customers all over the world six times per year.
Ericsson Review
Ericsson Review, Ericsson's technology journal, is published four times annually in English and Spanish.
Contact Online
Contact Online provides news and feature articles from Contact, Ericsson's English-language internal publication, which is distributed 21 times per year to Ericsson employees all over the world.
Kontakten på nätet
Kontakten på nätet (Swedish only) provides news and feature articles from Kontakten, Ericsson's Swedish-language internal publication, which is distributed 21 times per year to Ericsson employees in Sweden.
R380e - smarter than ever
Ansoff's Matrix - Planning fo Growth
This well known marketing tool was first published in the Harvard Business Review (1957) in an article called 'Strategies for Diversification'. It is used by marketers who have objectives for growth.
Ansoff's matrix offers strategic choices to achieve the objectives. There are four main categories for selection.
Ansoff's Product/Market Matrix
Market Penetration
Here we market our existing products to our existing customers. This means increasing our revenue by, for example, promoting the product, repositioning the brand, and so on. However, the product is not altered and we do not seek any new customers.
Market Development
Here we market our existing product range in a new market. This means that the product remains the same, but it is marketed to a new audience. Exporting the product, or marketing it in a new region, are examples of market development.
Product Development
This is a new product to be marketed to our existing customers. Here we develop and innovate new product offerings to replace existing ones. Such products are then marketed to our existing customers. This often happens with the auto markets where existing models are updated or replaced and then marketed to existing customers.
Diversification
This is where we market completely new products to new customers. There are two types of diversification, namely related and unrelated diversification. Related diversification means that we remain in a market or industry with which we are familiar. For example, a soup manufacturer diversifies into cake manufacture (i.e. the food industry). Unrelated diversification is where we have no previous industry nor market experience. For example a soup manufacturer invests in the rail business.
Ansoff's matrix is one of the most well know frameworks for deciding upon strategies for growth.
The matrix on the left, adapted from H I Ansoff, identifies some of the alternative directions in which development can take place:
2. Existing Markets/ New Products
Click for further information
3. New Markets/ Existing Products
Click for further information
4. New Markets/ New Products
Click for further information
. Existing Markets/ Existing Products
Click for further information
. Existing Markets/Existing Products
The 'do nothing' strategy implies the continuation of an existing strategy. It may be appropriate in the short-term when the environment is static or when the firm is waiting to see how situations develop. However, in the long term such tactics are unlikely to be realistic or beneficial. They may reflect a lack of strategic awareness on the part of the management team.
Withdrawal may take place through the sale of business or through divestment, the sale of part or all of the business. Withdrawal may be an appropriate strategy if:
* there is an irreversible decline in demand
* the firm is over extended
* the firm is adversely affected by competitive pressure and environmental change
* the opportunity cost is such that a better return can be earned if the resources used in the particular line of business are engaged elsewhere
Large conglomerate groups sometimes find themselves too thinly spread and many choose to withdraw from selected markets. Consolidation takes place when a firm concentrates it's activities on those areas where it has established a competitive advantage and focuses it's attention on maintaining it's market share. When this strategy has been prompted by falling profits, the situation is often referred to as retrenchment. Both cases may involve the firm in improvements to cost structure, increased emphasis on quality and increased marketing activity. In the case of retrenchment, the cost reductions may involve redundancies or the sale of assets.
Market penetration involves gaining market share as opposed to maintaining it (consolidation). When the overall market is growing, penetration may be relatively easy to achieve, because the absolute volume of sales of all firms in the market is growing and some firms may not be able to satisfy demand. In static or declining markets, a firm pursuing a market penetration strategy is likely to face intense competition.
2. Existing Markets/New Products
Product development involves the firm in substantial modifications, additions or changes to it's present product range, but it operates from the security of it's established customer base. In research and development-intensive industries, product development may be the main direction of strategy because product life cycles are short, and because new products may be a natural spin-off form the research and development process. New product development can be risky and expensive.
3. New Markets/Existing Products
Market development can include entering new geographical areas, promoting new uses for an existing product and entering new market segments. It is an appropriate strategy to pursue when the organisations distinct competence rests with the product rather than the market.
4. New Markets/New Products
Diversification can be classified as:
* Horizontal
* Vertical
* Conglomerate
Horizontal diversification refers to the development of activities which are complementary to or competitive with the organisation's existing activities. It is often difficult to distinguish between horizontal diversification and market penetration because classification depends on how narrowly product boundaries are drawn.
Nestle's take-over of Rowntree Mackintosh in 1988 is an example of horizontal diversification. Nestle is one of the world's largest food companies, but it's share of the chocolate confectionery market only amounted to some 3 percent in 1987; rowntree held around 26 percent and had a particularly strong range of countline products such as KitKat. Nestle's acquisition enhanced it's UK market position and reduced it's reliance on sales of solid chocolate bars, demand for which is growing more slowly than demand for chocolate coated products such s Mars Bars. Nestle's acquisition could be viewed either as horizontal diversification into a broader range of confectionery products or increased penetration of the UK confectionery market depending on where the industry boundary is drawn.
Vertical integration refers to the development of activities which involve the preceding or succeeding stages in the organisation's production process. Backward or upstream vertical integration takes place when the organisation engages in an activity related to the proceeding stage in it's production process. Forward or downstream vertical integration takes place when the organisation engages in an activity related to a succeeding stage its production process. Obvious examples of vertical diversification include the brewers' control of public houses and the oil industry's combination of exploration, refining and distribution.
Conglomerate diversification refers to the situation where at face value the new activity of the organisation seems to bear little or no relation to it's existing products or markets. For example, Hanson Trust's interests include engineering, batteries, building products and cigarettes.
The advantages of diversification include:
* cost savings due to the effects of synergy (where the combined effect exceeds the sum of the individual effects)
* spreading of risk
* control of supplies (mainly related to vertical integration)
* control of markets (mainly related to vertical integration)
* improved access to information
* escape from declining markets
* exploitation of under-utilised assets
Possible disadvantages of diversification include:
* inefficiency due to loss of synergy
* inefficiency due to loss of managerial control
STRATEGIC ANALYSIS FRAMEWORK
Strategic management is concerned with matching the organisation's internal capabilities with the external opportunities and threats and developing plans to achieve the medium to long term goals.
EXTERNAL AND INTERNAL DRIVERS FOR CHANGE
You need to be able to understand the external and internal influences or pressures affecting your management area of responsibility. It is unlikely that you will be able to influence the external influences, but you should be able to identify appropriate responses. Over on the right is a comprehensive toolbox of strategic analysis techniques, follow the links to examine these models and accompanying examples in more detail.
PESTLE ANALYSIS OF ENVIRONMENTAL INFLUENCES
The pestle analysis should identify and evaluate:
* Environmental factors the should or do influence strategy.
* Trends and possible/probable environmental developments, opportunities or threats that could be of strategic significance in the future.
PESTLE analysis focuses on external factors, breaking them down into the categories identified here. It allows you to identify exactly what changes the outside world holds for the organisation in the foreseeable future.
* The analysis should consider the implications for:
* The organisation
* Customers
* The industry/marketplace
* Intermediaries
* Competitors
* Other stakeholders
We can categorise changes in the external environment as follows:
Clearly, if you carried out the activity using the PESTLE headings, your response to the above activity will depend on the kind of organisation you work for.
Think about and research your organisation and the changes it has gone through in the past two or three years:
* List the most significant changes and for each one identify whether the organisation took action to anticipate the effects the change.
* Identify the principal issues and what impact they have had on the way in which the organisation operations in the wider environment.
* Explain why they will matter to you.
The changes you have identified in the above activity (both past changes and potential future ones) relate directly to the purpose of strategy - to minimise the potential damage and maximise the advantages.
There are a number of ways in which this can contribute to strategic analysis, consider:
* What environmental influences have been particularly important to the organisation in the past?
* Any of these more or less significant in the future for the organisation and its competitors?
* What environmental factors are affecting the organisation?
* Which of these are the most important at the present time?
* In the next few years?
A strategy is a plan of action. A strategy can only be successful if it enables an organisation to reach it's objectives. The first step in internal strategic analysis, therefore, is to identify the firms objectives. It is common to refer to mission statements, objectives and targets.
The mission of an organisation is a visionary statement concerning it's essential purpose or reason for being. Mission statements are general. They are often implicit and unwritten. But very company needs an objective to give it's people direction and focus. A good mission statement must fulfil a number of basic criteria, it must:
* Be specific enough to have an impact upon the behaviour of individuals throughout the business.
* Be focused more on the customer need-satisfaction than products and/or technology.
* Be based on a realistic assessment of the companies true strengths and weaknesses.
* Recognise the opportunities implied by the vision
* Be realistic and attainable
* Be flexible enough to allow for changes that a dynamic marketplace may entail
Objectives are desired states or results. Typical objectives derived from economic theory include:
* profit maximisation
* sales revenue maximisation
* growth maximisation
* managerial utility maximisation
If objectives can be measured and relate to a particular time scale they become targets.
Please provide details of you companies of your company's:
. Mission Statement
2. Statement of Strategy/Objectives
3. Statement of Targets
"A process of monitoring both internal and external changes which will ensure company awareness and assist in the prediction of future trends. It matches company capabilities with the wants of the customer and isolates restraining influences."
SWOT analysis can be a very useful way of summarising many of the other analyses and combining them with the key issues from environmental analysis. The aim is to identify the extent to which the current strategy of an organisation and it's more specific strengths and weaknesses are relevant to and capable of dealing with, the changes taking place in the business environment.
This simple technique provides a method of organising information in identifying possible strategic direction. The basic principle of SWOT analysis is that any statement about an organisation or its environment can be classified as follows (hover pointer over diagram for annotations):
A Weakness...
is simply any aspect of the company which may hinder the achievement of specific objectives such as limited experience of certain markets/technologies, extent of financial resources available.
This information would typically be presented as a matrix of strengths, weaknesses, opportunities and threats. There are several points to note about about presentation and interpretation:
* effective SWOT analysis does not simply require a categorisation of information, it also requires some evaluation of the relative importance of the various factors under consideration.
* these features are only of relevance if they are perceived to exist by the consumers.
* listing corporate feature that internal personnel regard as strengths/weaknesses is of little relevance if they are not perceived as such by the organisation's consumers.
* threats and opportunities are conditions presented by the external environment and they should be independent of the firm.
Having constructed a matrix of strengths, weaknesses, opportunities and threats with some evaluation attached to them, it then becomes feasible to make use of that matrix in guiding strategy formulation. The two major strategic options are as follows:
(a) Matching
This entails finding, where possible, a match between the strengths of the organisation and the opportunities presented by the market. Strengths which do not match any available opportunity are of limited use while opportunities which do not have any matching strengths are of little immediate value from a strategic perspective.
(b) Conversion
This requires the development of strategies which will convert weaknesses into strengths in order to take advantage of some particular opportunity, or converting threats into opportunities which can then be matched by existing strengths.
Although SWOT provides some guidance on developing a match between the organisation's environment and it's strategic direction, it is also necessary to consider more specific aspects of strategies such as how best to compete, how to grow within the target markets etc. To aid this process there are a number of analytical techniques which can be used; the role of these techniques is not to offer definitive statements on the final form that a strategy should take, but rather to provide a framework for the organisation and analysis of ideas and information. No one technique can always provide the most appropriate framework and those discussed below can and should be regarded as complementary rather than competitive.
The theory of the product life cycle is that all products, brands and industries move through identifiable phases from introduction through to maturity and decline. Associated with each phase will be changes in the unit margin, the gross margin and the product or brand strategy.
The phases in the product life cycle are:
. Introduction: a period of slow sales growth as the product is introduced to the market. Profits are non-existent in this stage because of the heavy expenses of product introduction.
2. Growth: a period of rapid market acceptance and substantial profit ...
This is a preview of the whole essay
The theory of the product life cycle is that all products, brands and industries move through identifiable phases from introduction through to maturity and decline. Associated with each phase will be changes in the unit margin, the gross margin and the product or brand strategy.
The phases in the product life cycle are:
. Introduction: a period of slow sales growth as the product is introduced to the market. Profits are non-existent in this stage because of the heavy expenses of product introduction.
2. Growth: a period of rapid market acceptance and substantial profit improvement.
3. Maturity: a period when sales growth slows down because the product has achieved acceptance by most of the potential buyers. Profits stabilise or decline because of increased marketing outlays to defend the product against competition.
4. Decline: the period when sales show a strong downward drift and profits are eroded.
As with all analytical tools, the value of the product life cycle lies in understanding how to use it. The key to using the technique is to decide the phase your products are in and where you will take them next. This tool is to encourage you to identify the exact circumstances of your products and services and what you need to do with them.
Based on the model developed by Arthur D Little, the position within the life cycle is determined in relation to eight descriptors or evolution:
. Market growth rate
2. Growth potential
3. Breadth of product lines
4. Number of competitors
5. Spread of the market share between competitors
6. Customer Loyalty
7. Entry barriers
8. Technology
The position in relation to competition can be classified as:
* dominant
* strong
* favourable
* tenable
* weak
Use of this approach narrows the range of strategic options open to the organisation and identifies those which are worthy of further consideration.
RELATIVE MARKET SHARE
On this type of grid you plot the position of each of your products and or services and denote these by a circle. The size of the circle indicates the revenue generated by each product and places an arrow in the direction you think each is moving.
* What does this tell you about the balance of your product portfolio?
* Are you trying to fund too many new products?
* Are there products that should be dropped?
* Is there a need for immediate new product development?
* Is your marketing effective and successful?
* What strategies should you now be adopting for each product?
The framework provided by the matrix can offer guidance in terms of developing appropriate strategies for products and in maintaining a balanced product portfolio ensuring that there are enough cash-generating products to match the cash-using products. Even if your analysis is relatively crude. It will guide you to some conclusions.
It may also cause you to put in place some improved information to help you repeat the analysis later.
However, there are a number of criticisms:
* The Boston Matrix oversimplifies product analysis. It concentrates only on two dimensions of product markets,
size and market share, and therefore may encourage marketing management to pay too little attention to other
market features.
* It is not always clear what is meant by the terms 'relative market share' and 'rate of market growth'.
Not all companies and not all products will be designed for market leadership, in which case describing
performance in terms of relative market share may be of limited relevance. Many firms undertaking this approach
have found that all their products were technically 'dogs' and yet were still very profitable, so saw no need to divest. Firms following market nicheing strategy will commonly find this occurring since they are looking to appeal
only to a limited segment of the market.
* The validity of the matrix depends on the notion of a relationship between profitability and market share.
There is empirical evidence for this in many industries, but it may not always be the case, particularly in situations
where there is demand for more customised products.
* The basic approach may oversimplify the nature of products in large diversified firms with many divisions.
In these cases, each division may contain products which fit into several of the categories.
* The above tool is not as well suited to pubic sector managers. Market share and market growth may not have
the same focus. In which case the GE matrix analysis tool may be better suited.
INTRODUCTION
The Boston Matrix was developed by the Boston Consultants and is a useful analysis tool to understand your product/service portfolio. The Boston Matrix, illustrated here, works by classifying products (or businesses) on the basis of their market share relative to that of their competitors and according to the rate of growth in the market as a whole. The split on the horizontal axis is based on a market share identical to that of the firm's nearest competitor, while the precise location of the split on the vertical axis will depend on the rate of growth in the market. Products are positioned in the matrix as circles with a diameter proportional to their sales revenue. The underlying assumption in the growth-share matrix is that a larger market share will enable the business to benefit from economies of scale, lower per unit costs and thus higher margins. Hover pointer over diagram for descriptions.
PROBLEM CHILD
The introductory stage of the Product Life Cycle with a large negative cash flow. These are products with low market share competing in rapidly expanding markets. If they are successful they become stars, but in the question mark stage they are risky and require ongoing investment. This makes them at best, only marginally profitable in the short term. IBM's new family of personal computers in the PS2 range, is an example of a question mark or Problem Child product, perhaps destined to become a star.
STARS
Equivalent to the growth stage of the Product Life Cycle. Cash flow may be modestly positive or negative. Stars are market leaders in growth markets. They need to defend their market position and require ongoing investment; consequently they do not generate as much profit for the organisation as Cash Cows. Examples include products in the high-tech market.
DOGS
Products in the decline stage of their life. They may generate some modest cashflow. Dogs are Cash Cows past their best. They are products which have lost market share to competitors and are operating in static or at best slow growing markets. Their profitability is declining and eventually they may be withdrawn. Examples include electromechanical typewriters and cash registers which have been superseded by word processors and sophisticated electronic tills.
CASH COWS
The mature products of the portfolio - are or should be cash generators. Cash Cows are well established products in mature markets which generate funds for other parts of the business. Examples include Rank Xerox's 941 Copier and British Telecom's UK telephone network.
The GE Matrix was developed by the consultants McKinsey for General Electric. It is useful for any type of organisation and allows a product/service to be analysed in terms of dimensions of value to the organisation and dimensions of value to the customer.
A:
products in these quadrants are valued by the customer and the organisation and should be developed by investment and internal improvement.
B:
Products in these quadrants are only of medium value and need to manage carefully to avoid them slipping into category C.
C:
These are unattractive products and should be withdrawn from the portfolio.
Value to the Company
Why should the organisation want to offer this product or service? It may be that:
* it is very profitable
* it provides the organisation with a good image
* there is a huge demand for it
* there is no investment required
* it's what the organisation is good at providing etc.
Value to the Customer
Why should your customers buy this product or service?
These are the criteria that provide you with competitive advantage:
* Price
* Quality
* Delivery performance
* Pre-sales advice
* Product reliability
* Product performance
* Availability, etc.
The first stage in the analysis is to develop for each product a list of the things you believe makes the product or service attractive to the company. Try to quantify these where appropriate. Consider for example:
* Contribution
* Ease of producing
* Integration with other products/services
* Potential growth
* Cost of resources
* Skill base
* Image, etc.
Marketing Theory | Educational links | Marketing Online Quiz | Marketing Courses (UK) | AVCE (UK) | University Bulletin Board (UK) | Marketing Glossary | Student Notice Board
Boston Consultancy Group (BCG Matrix)
This product portfolio matrix classifies product lines into four categories. The BCG models suggests that organisations should have a healthy balance of products within their range. The Boston Consultancy Group classified these products as following:
Dogs
These are products which have low market shares and low market growth rates. The options for many companies is to phase these products out, however some organisation do go for the strategy of re-inventing and injecting new life into the product. (see Heinz Case Study)
Question Mark/Problem Child
These are products with low market share but operate in high market growth rates. The company puts a lot of resources in this product in the hope that it will eventually increase market share and generate cash returns in the future.
Star
Stars have high market shares that operate in growing markets. The product at this stage should be generating positive returns for the company.
Cash Cow
Cash Cow are products at the mature stage of the lifecycle, they generate high amounts of cash for the company, but growth rate is slowing. There are chances that the product may slip into decline, appropriate marketing mix strategies should be employed to try to prevent this from happening.
First published 05 March 2002]
Sony Ericsson has launched eleven new products at press conferences around the world. It's not just new phones but also new Bluetooth products and accessories that premiered at special press conferences in London, Stockholm, New York and other major cities.
From Day One, the world has been anxiously waiting to see what Sony Ericsson has had up its sleeve. For five months, SEMC has kept quiet. Now, one week before CeBIT, Sony Ericsson is announcing a new portfolio consisting of eleven phone and accessory products. In Greece, Italy, Mexico, Brazil, Taiwan, Japan and USA among other places, Sony Ericsson met with the press.
One of the products that sparked the most interest was the P800, a new Smartphone with, among other things, a color touch screen, built-in camera, photo album, telephone book with photos, e-mail, SMS, EMS, MMS, WAP and triple-band.
Z700 is a new gaming and entertainment phone with a Java virtual machine that makes it possible to download games.
T68i is the follow-up to the popular T68. It is the world's first product to support multimedia messaging service MMS, and Sony Ericsson's first GSM-product. It also has a color-screen like the T68, but introduces subtle design enhancements and new features.
The CommuniCam MCA-20 is a plug-on accessory camera for use with theT68i. With it, users can capture a moment and instantly send pictures as e-mail attachments to a PC or as MMS to a phone. The camera uses the display of the T68i as a viewfinder.
The T61g is a central tier GSM-phone for the American market. It features more than hours of talk time, PC synchronization, voice commands, always-on Internet, email, EMS and cool blue backlighting for viewing messages in the dark.
The T62u supports both TDMA and GSM networks, and is the first Java phone for the Americas.
T206 is an entry tier product for CDMA networks. It features EMS, voice commands, GPS and 1xRTT (high data rate).
A new Bluetooth headset, HBH-30, The Bluetooth car handsfree, HCB-30, and the Chatpen is also among the eleven products. As well as the GC75, a powerful triple-band GSM/GPRS PC card modem that makes it possible to work conveniently when out of the office.
Read more about Sony Ericsson at: http://www.sonyericsson.com
THE SALE AND SUPPLY OF GOODS ACT 1994
&
THE SALE OF GOODS ACT 1979
Your new automatic kettle boils dry; your 'feather' pillow is filled with polyester; the carpet which the shopkeeper said was very tough and suitable for stairs has holes in it after just five months. What can you do? The solution to these problems is in the Sale and Supply of Goods Act 1994.
Once a seller has accepted your offer to buy, a legal contract has been made between you. This gives both you and the seller certain rights. (For a detailed explanation, see the factsheet The contract between buyer and seller.) You may, for example, be entitled to a full refund of the price you paid if there is a hole in your new dress. But if you simply decide you don't like the colour, the seller can refuse to refund your money.
YOUR RIGHTS UNDER THE SALE AND SUPPLY OF GOODS ACT 1994
Goods must be of satisfactory quality - this applies to new and second-hand goods bought from a trader (but not from a private individual). This means that goods should be durable, safe and have acceptable appearance, taking into account their price, nature, any description applied to them and any other relevant circumstances. In practical terms this means:
* a new garden hose shouldn't have a hole in it;
* the handle on your new suitcase shouldn't break the first time it's used.
If goods are very cheap you can't expect top quality, but whatever the price they shouldn't be faulty. Sale goods that aren't marked as sub-standard should also be fit for their normal purpose.
The seller has rights too: -
* If you were shown a specific defect before you paid (a small flaw in dress material perhaps), you can't complain later.
* If you examined goods before you bought them you can't complain about faults which you should have seen. It's not a question of whether you spotted the defect, but whether you should have done so.
These exceptions are most likely to apply to sale goods and to second-hand goods.
YOUR RIGHTS UNDER THE SALE OF GOODS ACT 1979
2 Goods must be fit for any particular purpose made known either expressly or by implication, to the seller - this applies to new and second-hand goods bought from a trader (but not from a private individual).
Usually, you don't have to give the reason why you need goods, but if you do, the seller should recommend suitable ones. If, for example, you tell a shopkeeper that you want to buy a warm winter duvet, he shouldn't try to sell you a lightweight summer one. You must, however, mention any special circumstances which the seller couldn't be expected to know (an allergy to something, for example).
The seller has rights too:
* If you ignore the seller's advice about a product, you have no grounds for complaint if the item isn't fit for the purpose. Usually, the simple fact of going to a particular shop suggests confidence in the seller's ability. It has to be proved that you didn't rely on his judgement. Similarly, if you follow a friend's advice rather than the seller's you can't complain to the seller later.
* The seller can show it was unreasonable for you to rely on his advice. Again, this has to be proved
3 Goods must be as described - this applies to new and second-hand goods bought from a trader or a private individual. A 'leather' personal organiser shouldn't be made from plastic and 'solid wood' furniture shouldn't be veneer.
The Unfair Contract Terms Act 1977, amended by the Unfair Terms in Consumer Contracts Regulations 1994, says that these three basic rights can't be left out or restricted if you are an ordinary consumer. If you are buying goods for use in a business, your Sale of Goods rights can be excluded, but only when the seller can prove that this is reasonable.
If you receive goods as a present you aren't entitled to make any claims - the buyer must do this if anything goes wrong.
REMEDIES AVAILABLE UNDER THE ACTS
If the seller breaks any of the three rules you are entitled to claim against him. Exactly what you can claim depends on whether you are considered to have 'accepted' the goods.
Acceptance has a special legal meaning. You are considered to have accepted goods if:
* you give the seller reason to believe you have done so;
* you keep the goods for a reasonable period of time without telling the seller that you don't want them. A 'reasonable time' is not defined in the Act - it depends on the goods and circumstances, and can only be decided by a court.
If you haven't accepted the goods and assuming they are either faulty, not fit for the purpose for which they were sold, or not as described, you can reject them and claim your money back. You may be offered a credit note, free repair or replacement instead - you don't have accept any of these options if you would rather have your money back.
The buyer is not deemed to have accepted the goods because he asks for or agrees to a repair.
If goods which you haven't previously examined are delivered, by law you haven't accepted the goods until you have examined them. The buyer must be given a reasonable opportunity to examine them, that is, a lawn mower bought in Winter couldn't be tested until Spring.
If a shop has a sign saying 'No refunds given', you can report it to your local Trading Standards Department. Under the Consumer Transactions (Restrictions on Statements) Order 1976, this is an offence.
If you have accepted the goods you can't claim a refund, but if they are faulty you are entitled to compensation (called damages). You can either ask for a discount if the goods still have to be paid for or claim compensation. You are entitled to the difference between the value of the faulty goods and what you paid (or expected to pay) thinking they were in good condition. If you claim damages you must try to minimise your losses, for example, by accepting the first offer of free repair or a replacement. You can also claim any expenses that you incur, such as the cost of hiring a car while yours is being repaired.
If you can't return goods in the same condition as when you bought them, either because they have been misused or damaged, you will still be considered to have accepted them. Even though you have caused the damage, you might still be able to claim damages if you can prove that the goods were faulty when you bought them.
MISCELLANEOUS PROVISIONS
The Act also says that unless otherwise agreed, it is the customer's responsibility to collect goods from the seller's premises.
Sale of Goods Act
Sale of Goods Act and Supply of Goods and Services Act 1982
. All transactions should be conducted within the terms of these Acts.
2. The goods should be:
* of merchantable quality
* properly described
* fit for the purpose
3. If a customer insists on making a purchase against the member's advice he should be warned at the time of purchase that his rights under the Act might be limited. The retailer may refuse a sale on welfare grounds.
4. Full and clear information must be given upon request regarding goods, services and livestock.
5. All services provided must be undertaken with reasonable care and skill and, unless a specific time has been agreed beforehand, within a reasonable time.
6. The customer must be prepared to pay a reasonable charge.
7. A customer cannot query a price which has been agreed beforehand.
8. The Supply of Goods and Services Act 1952 does not apply in Scotland, but similar provisions exist under common law.
Pricing
9. Misleading price offers must not be used.
0. Discounts offered should be based on fair comparisons.
1. Any credit facilities offered must be clearly stated in writing. and members must abide by the terms of the Consumer Credit Act 1974. Members are reminded that a licence may be required.
Complaints
2. The member will make every effort to resolve any dispute between himself and the customer.
3. All staff must be suitably trained to deal with complaints, but should difficulties arise the matter should be referred to senior member of staff.
4. At all times the person dealing with the complaint should adopt a courteous manner, act with tact and handle the problem sympathetically. The problem should be settled speedily if at all possible.
5. If the complaint cannot be resolved the following procedures are available:
* Local Advice
* Both the member and the customer have the right to contact the Trading Standards Department or the Citizens Advice Bureau.
* Conciliation Service
If there is still no agreement OATA Ltd can be asked to offer a conciliation service. There is no charge for this service.
Environment
Sony Ericsson takes environmental responsibilities very seriously. Below is a general statement about our policy.
Entertaining the world, caring for the future.
Sony Ericsson considers sustainable development as one of the most important challenges for the future and is committed to the environment and to fulfilling our customers' demands for environmentally adapted products and services. We aim to deliver solutions that help to reduce global resource consumption and emissions to air, land and water.
Environmental work at Sony Ericsson is based on a life cycle approach. Environmental concern is integrated in product design and supplier selection and Sony Ericsson works to improve product recycling.
Sony Ericsson has the first online collection of environmental product declarations for the main part of our mobile phones. The Sony Ericsson Environmental Declarations give information on the most relevant environmental aspects of mobile phones, including material content, energy consumption, batteries, packaging and recycling.
For more detailed information on visions, actions and results please visit the corporate environmental web sites for Sony and Ericsson.
* Ericsson Corporate Environmental Web Pages
www.ericsson.com/environment
* Sony Corporate Environmental Web Pages
www.sony.co.jp/en/sonyinfo/environment
Energy is no.1
Ericsson has determined that energy use is the most significant environmental aspect of our business activities.
Energy is consumed at a number of stages: by our products when they are used, at our workplaces, in business travel and commuting, and for the production of our products.
Using energy results in carbon dioxide, CO2, emission which has been proved to contribute to global warming. Globally, most CO2 emissions are attributable to the burning of fossil fuels, primarily in the transportation and power generation sectors. The telecommunication industry makes a very small contribution to the CO2 emission total, yet has a critical role to play in helping to reduce it .
Ericsson founding member of sustainability initiative
[First published 26 July 2001]
The recently-launched Global eSustainability Initiative, with the support of the United Nations Environment Program and the International Telecommunication Union, aims to promote business practices and the development of sustainable applications. It's the first time an industry organization has committed itself and its technology to enabling a more resource-efficient world.
A number of leading telecom suppliers and operators are involved in the new effort. Besides Ericsson, founding members are BT, AT&T, Deutsche Telecom, Cable &Wireless, Marconi, Telenor and Lucent Technologies. The group is set up as a forum where members exchange information and resources.
Ericsson is represented at GeSI by its head of Corporate Sustainability and Environmental Management Network Organization, Mats-Olov Hedblom (pictured.) Michele Schmidt, head of Marketing for the department, says the information and communications industry (ICT) is key in the effort.
"ICT is a clean industry," says Schmidt, "and it can help provide alternatives to the transportation of people and goods as well as make more efficient use of resources when transportation is necessary. Application development is an essential part of this process."
One way Ericsson practices such environmental efficiency is its use of Web meetings. Schmidt says the executive management team has "met" a number of times via web conferencing, all on the server at the same time viewing presentations and discussing issues. The relief on the environment is enormous: a round-trip flight from Stockholm to London, for example, emits a half-ton of carbon dioxide emissions.
Schmidt says beyond the GeSI, Ericsson has a broad, active sustainability environment program. "Sustainability has been a part of our corporate vision statement for a long time. We're doing a lot that is visible and there is much more activity behind the scenes," she says.
Read more about Ericsson's environmental activities at: http://www.ericsson.com/environment/
3G and the environment
For Ericsson, cost and the environment go hand in hand. 3G products will be designed, produced and delivered with environmental considerations implemented at each step. That is to say, we are taking great steps to help minimize energy consumption and reduce the drain on natural resources.
As a result, our products will be more energy-efficient during operation and will avoid the use of hazardous substances which will, in turn, reduce disposal costs. We will even offer take-back services in selected markets when the operator no longer needs a product or wishes to upgrade. We believe that this approach will minimize total life-cycle costs and environmental impact. It's better for business and better for the environment, and ultimately better for operators and end-users.
The impact of 3G on society will be profound. The possibility to transport ideas, not people, will pave the way to a world more committed to environmental responsibility and will simultaneously improve the quality of life of millions of users.
Environmental Management System
In 2001, we made significant progress in this area by adopting an Environmental Management System (EMS), which is now in operation worldwide.
A single global system enables us to assess our environmental impacts independently of organizational structure and changes. The EMS gives us a clear and consolidated view of all our environmental impacts, and actions. This global view avoids the fragmented sub-optimisation that might result from parts of our organization working independently.
Our EMS received the first-ever global ISO14001 certification granted by the British Standards Institution (BSI). This certification covers all of Ericsson's operations - manufacturing and non-manufacturing - and verifies that we have identified the key environmental aspects/indicators to be monitored. It also affirms that we have set relevant targets for continuous improvement and that systems are in place to support these and measure results accurately.
It has taken us just over two years to design and implement our EMS and to have it certified. World events in 2001, a corporate reorganization and the addition of a new manufacturing facility late in 2001 have left some parts of the organization outside of this system. However, our commitment to a global EMS remains strong and we are working to integrate these during 2002.
Not only has Ericsson achieved certification for our EMS, but we now also ask this from our suppliers. Currently 80 percent of our largest suppliers are implementing an EMS, or already have an EMS certified to ISO14001 or equivalent.
Ericsson's profile
Energy - a key indicator of environmental performance
Emissions ->
Gasoline ->
Ericsson has determined that energy use is the most significant environmental aspect of our business activities. Energy is consumed at a number of stages: by our products when they are used, at our workplaces, in business travel and commuting, and for the production of our products. Using energy results in carbon dioxide, CO2, emission which has been proved to contribute to global warming. Globally, most CO2 emissions are attributable to the burning of fossil fuels, primarily in the transportation and power generation sectors. The telecommunication industry makes a very small contribution to the CO2 emission total, yet has a critical role to play in helping to reduce it.
Environmental impact per subscriber - reduced by half
Ericsson has succeeded in reducing the environmental impact per subscriber of mobile telephony by approximately 50 percent in just a few years. We have achieved this by exploiting the rapid development in microelectronics to drastically reduce both the size of the products and their energy consumption.
From an environmental standpoint, each new generation of exchanges or telephones is superior to the preceding one. Furthermore, because using fewer resources results in lower operational cost and less space and rent required to house equipment, environmental improvements contribute to the competitiveness of both Ericsson and our customers.
The diagram below compares an older mobile system (with products from 1991 to 1996) with a more recent system (from 1997 to 1999) throughout their life cycles. The scope of the studies included Ericsson equipment, such as switching equipment, radio base stations and mobile telephones. It also included hypothetical use of the systems by a customer. This work builds on the results of studies of two real systems described in the life cycle assessment section of this report. The elements measured are energy consumption for production and operation (recalculated as liters of gasoline/subscriber/operating year). We project a useful life of ten years for the network equipment and three years for mobile telephones.
This diagram illustrates that the most significant environmental impact is during the operation phase, so we have focused our improvement efforts in this area. A continuing challenge is to reduce production-related impacts, since the equipment currently contains some key components derived from energy-intensive production.
Listed in the right table are the years when the main products in the networks were introduced into volume production. It also shows the extent to which they diminished in weight and energy, compared with the preceding generation.
Reduction of weight (percent)
Reduction of energy (percent)
Mobile telephones (1997-1999)
20
85
Radio base stations (1992-1996)
60
40
Exchange equipment
80
80
Ericsson's total environmental footprint
This is the consecutive third year that Ericsson has published its environmental profile. Our profile is expressed as carbon dioxide (CO2) emission per employee. This profile encompasses activities, such as work-related travel and energy consumption in offices and plants, that relate to our own operations. This year, we included the impact of employee commuting in the transport values. The values shown for car travel in previous years have been adjusted for comparison.
The increases in electricity used in our site reflect substantially higher production volumes. The apparent increases in air travel are primarily due to improved methods for determining its impact, and also to increased worldwide sales.
Measurements over the last three years have been based on average values. While this gives a general indication of trends, it is not precise. In future, we will use the EPW tool (see page 15). EPW will provide more accurate information based on input from each employee. It also raises awareness among our employees of workplace-related environmental issues.
News
Ericsson wins Best Paper Award at Eco Design in Japan, Dec. 2001 for "Solar Powered Mobile Telephony"
Ericsson gets first global ISO certification from BSI
Code of Conduct
to ensure that standards of social responsibility and ethics are met all the way down the supply chain.
Questions and Answers
How frequently do Ericsson employees shut down their computer when leaving the office?
2001 Report
Download pdf
Order printed version
Sony Mid-Term Environmental Action Program "Green Management 2005"
Sony developed the Green Management 2005 Mid-Term Environmental Action Program in March 2001 to attain the goals and eco-efficiency targets incorporated in the Sony Environmental Vision. This new action program supersedes its predecessor, Green Management 2002. It will be reviewed annually and when laws, regulations or social trends change.It comprises the 16 chapters below, each containing detailed, concrete goals for accomplishment by fiscal 2005.
Sony endeavors to have every employee conduct business in accordance with the environmental management system and to try to achieve the targets.
Corporate Citizenship
2 New Business Planning
3 Research and Development
4 Procurement and Purchasing
5 Product Design
1) Environmental Requirements for Products 2) Specific Environmental Requirements
6 Site Management
1) Energy Conservation 2) Waste 3) Hazardous Materials
4) Water Resources 5) Paper Resources 6) Vehicle Fuels
7 Expanding and Revising Business Activities
8 Marketing and Logistics
9 Customer Services
0 Product Recycling
1 Risk Management System and Occupational Health and Safety Management
2 Environmental Education
3 Public Relations/Communications
4 Environmental Accounting
5 Data Collection
6 Information Systems
Green Management 2005 establishes numerical targets wherever possible to permit periodical progress evaluations. This section introduces the most significant numerical results.
These indicators are of two primary types:
* Environmental performance indices
* Environmental management indices
Environmental Performance Indices Targets:
Items with a Direct Environmental Effect
Energy-related Items
Sites
Reduce CO2 emissions per sales unit by 15% or more compared with FY2000 by FY2005 year-end.
Carbon offset contribution(Renewable energy, etc.)
Aim to increase the ratio of renewable resources to 5% or more of all energy consumed at each site by FY2005 year-end.
Site-owned vehicles
Reduce CO2 emissions per sales unit by 20% or more compared with FY2000 by FY2005 year-end.
Logistics
Reduce CO2 emissions per sales unit by 15% or more within the Sony Group compared with FY2001 by FY2005 year-end.
Products
Reduce CO2 emissions per sales unit by 15% or more compared with FY2000 by FY2005 year-end.
Reduce standby power consumption to less than 0.1 W by FY2005 year-end.
Resources Input
Green purchasing
Achieve a 100% Green Purchasing ratio for materials not for production purposes, such as office supplies, by FY2002 year-end.
Paper
Reduce the amount of paper used by 20% per sales unit compared with FY2000 by FY2005 year-end.
Achieve 100% use of recycled paper.
Products
Reduce product weights or number of parts by 20% compared with FY2000 by FY2005 year-end.
Increase ratio of recycled materials used in products to their weight of 20% compared with FY2000 by FY2005 year-end.
Packaging materials
Use environmentally conscious materials, such as recycled products, for all packaging by FY2005 year-end.
Resources Output
Sites
Reduce total weight of waste generated at sites by 30% per sales unit compared with FY2000 by FY2005 year-end.
Realize zero-landfill by FY2005 year-end.
Product recycling
Create a collection and recycling plan for major products by FY2005 year-end.
Conduct research on the recycling of plastic materials, and then introduce measures based on the research at treatment plants by FY2005 year-end.
Water Resources
Sites
Reduce the volume of water purchased or drawn from ground water at sites by 20% per sales unit compared with FY2000 by FY2005 year-end.
Hazardous Materials
Sites
Class I substances: Prohibited
Class II substances: Phase out by FY2005 year-end.
Class III substances: Reduce emissions by 90% or more compared with FY2000 by FY2010 year-end.
Class IV substances: Use under strict supervision in full compliance with relevant laws and regulations.
Products, service and marketing (Considered from different perspectives to identify special circumstances concerning safety standards, quality or market demand, etc.)
Employ lead-free solder in all products by FY2005 year-end.
Eliminate vinyl chloride from all products by FY2005 year-end.
Try to totally eliminate halogenated flame retardants by FY2005 year-end if substitute flame retardants confirmed to be safe are available.
Totally eliminate cadmium, chromium VI compounds, lead and mercury from all products by FY2005 year-end.
Environmental Management Indices Targets:
Items with an Indirect Environmental Effect
Corporate citizenship
Support regional environmental events once a year or more at each site.
Risk management system
Conduct evaluations based on the Guidelines annually at each site.
Environmental education
Provide environmental training course for all management staff by FY2002 year-end.
Environmental communication
Publish environmental report (including site reports) annually for disclosure.
Disclose Sony Group environmental performance information quarterly.
Conduct environmental advertising at least once a year.
Environmental accounting
Disclose environmental accounting information in site reports for every site by FY2003.
Incorporate environmental elements in decision-making on budget control of environmental activities and capital investment by FY2003.
Environmental Activities in the Business Process
Sony environmental activities are conducted throughout the business process, from the facility design and construction through purchasing of parts and raw materials to manufacturing, sales/logistics, and servicing of products. The below is the explanation of environmental protection activities in the business processes related to the manufacturing of hardware products.
-the business process, from the facility design and construction-
Sony undertakes environmental initiatives in the planning and construction of manufacturing plants and service-related offices. As part of environmental protection efforts in construction, Sony conducts a comprehensive environmental life-cycle assessment (LCA) to evaluate and analyze environmental impact from the construction of new production facilities. Sony also works actively to introduce solar energy and wind power.
·
For details regarding facility design and construction : See relevant pages in Environmental Report 2001.
Sony has introduced renewable energy sources such as solar power and wind power, and to improve energy conservation has installed highly efficient boiler systems, ice thermal energy storage devices,and co-generation systems. Covering rooftops with greenery is another example of Sony's many activities aimed at conserving energy.
Ice thermal storage tank at Sony Semiconductor Kyushu Co. Kokubu Technology Center at Kokubu, Kyushu.
· For details regarding energy conservation activities: See relevant pages in Environmental Report 2001.
Sony strives to use and reuse Earth's limited resources efficiently and to keep waste disposal to a minimum. These efforts encompass not only Sony's production processes, but also products and packaging. Sony is working to reduce waste by cutting waste sent to landfill to zero, minimizing product size and weight, and the retrieval and recycling of used products.
·
For details regarding resource conservation and waste management : See relevant pages in Environmental Report 2001.
In order to reduce the use of chemical substances which may have an impact on the environment, Sony has established a management system classifying hazardous materials in four categories, class 1 (use prohibited), class 2 (phase out), class 3 (reduce), and class 4 (control). Sony continues to seek substitutes for environmental pollutants and to reduce the volume of hazardous materials moved or emitted to air, water and soil.
· For details regarding chemical substances : See relevant pages in Environmental Report 2001.
The prevention of environmental accidents in the production process is a top priority to Sony, and a global risk management system has been established which monitors environmental risks quantitatively. Sony also conducts environmental audits within sites, with each regional Environmental Conservation Committee and in cooperation with third party organizations. Following a set of Guidelines for Environmental Risk Management, risk assessment is conducted on both the hardware and software aspects (the latter including procedures and staff education) of for example aboveground oil tanks. The environmental risk of each site are evaluated and at sites with particularly large environmental risks special audits and other preventative measures are taken.
Heavy oil storage tanks installed aboveground at Sony EMCS Corporation Minokamo TEC (Japan)
· For details regarding environmental risk management : See relevant pages in Environmental Report 2001.
In conjunction with environmental conservation activities, Sony takes global measures to protect the health and safety of employees and to reinforce its fire and disaster prevention preparedness. Based on "Sony's Global Policy on Occupational Health and Safety", and in order to take a proactive approach to disaster risks reduction, occupational health and safety management systems such as BS8800 or OHSAS18001, etc., have been established. In conjunction with environmental audits, health & safety and disaster prevention audits are carried out regularly by regional committees.
·
For details regarding occupational health & safety and disaster prevention : See relevant pages in Environmental Report 2001.
Sony aims to work with modal shifts and in cooperation with other manufacturers to achieve joint distribution and the reduction of fuel consumed. Efforts are also taken to recycle packaging. An environmental approach is also taken in marketing and the improvement of fuel efficiency or the introduction of low emission vehicles for sales teams are actively encouraged. In servicing, the recycling of waste parts, and the separation of soldering scraps, printed wiring boards, discarded electrical appliances, as well as of post-consumer packaging and corrugated cardboard is promoted. Further, in order to extend product lifetime, the utilization of standard components and the improvement of servicing activities are pursued.
· For details regarding distribution, sales, and service : See relevant pages in Environmental Report 2001.
Sony conducts recycling of products, parts and packaging material adapted to the conditions in each region or country. A unique Sony recycling initiative utilizes limonene extracted from citrus fruits to recycle polystyrene foam. In 1992, pioneering the industry, Sony started retrieving and recycling rechargeable lithium batteries. Regarding TV sets, recycling systems have been established in both Japan, USA, and Europe. Further, as part of continuous activities, progressive technological research and development is conducted with the aim to recycle personal computers, magnetic tapes and CD-ROMs.
Transporting disposed TV-sets in Minnesota, USA.
· For details regarding product recycling : See relevant pages in Environmental Report 2001.
· Details on limonene recycling.
· Information on the recycling of home electrical appliances in Japan.(only in Japanese)
There are two main types of pricing methods, these are: cost based pricing methods and market orientated pricing methods.
With cost based pricing methods, no account is taken of market requirements but a set amount is added to the costs. The disadvantage is that if costs increase, the price of the product must also increase. The following are examples of cost based pricing methods:
Absorption cost pricing: Used mainly in large department stores. The price of each product is dependant on how many costs it creates.
Target pricing: A target price is made and then costs are adjusted so that that price can be achieved.
Market based pricing methods depend on accurate analysis of the market and consumer requirements. The following are examples of market based pricing methods:
Penetration pricing: Used for new products wanting to gain market share. The product is priced low so that it is able to get a hold in the market.
Market skimming: When a new innovative product is bought out - during the first few months high prices can be charged as there is little competition and the product is popular because it is new.
Loss leader pricing: Charging below cost price to try and attract customers to other products (normally in supermarkets).
Psychological pricing: Hitting price points that are significant e.g. £99.99 sounds better than £100.00
Price discrimination: Charging different people different prices for effectively the same product. Normally time based (charging different prices at different times of the day / week / year)
Discount pricing: Offering lower prices for a set time period to try and boost sales and sell off unwanted stock.
There are two types of competition based pricing methods:
Going rate or market pricing: Charging the same as competitors or the market leader.
Destroyer or destructor pricing: Charging a price below average to drive out competition.
There are 3 main types of marketing: undifferentiated marketing, differentiated marketing, and concentrated marketing.
Undifferentiated marketing assumes everyone is the same and aims a particular product at everyone. Advantages: easy to plan, doesn't miss anyone. Disadvantages: can be wasteful, ignores segmentation, can lead to disappointing sales.
Differentiated marketing aims the product at specific segments in the market. The company may be trying to sell exactly the same product to different segments but it will change its promotional methods and the image it creates. Advantages: separate mix can be developed for each segment, different markets can be easily identified. Disadvantages: Can be costly, message may by-pass some customers.
Concentrated marketing is when the message is aimed at just one small market. Advantages: Small firms can concentrate their marketing, allows a specific mix to be developed. Disadvantages: Ignores other areas of the market, can cause problems in future as may make it more difficult for company to expand.
Top of Form
ENTER YOUR PAPER TOPIC:
Bottom of Form
Brand leader. The company with the highest percentage share of a certain market.
Branded goods. Goods with a brand name or identity.
Cash cow. A product with high market share of a low growth market.
Cluster sampling. Choosing people from a specific area.
Complimentary goods. Products that go well together e.g. fish and chips.
Constraints. Factors which prevent the company from being able to meet its objectives.
Cost plus. Adding a set profit percentage to estimated total cost per unit.
Dog. A product with a low market share of a low growth market.
Extension strategy. A plan for lengthening the cycle of a product or brand.
Global marketing. Marketing throughout the world as if it was one big market by using the same brand, advertising etc.
Industrial markets. Selling goods and services to other companies.
Market intelligence. Often data collected by market research on consumers, distributors or competitors.
Market mapping. Selecting variables that differentiate brands within a market (e.g. price) and then plotting the position of each product on a graph. This enables firms to identify gaps in the market.
Market research. The process of gathering data to enable marketing decisions to be made accurately based on relevant information.
Market share. The percentage of sales by a certain company; largest is market leader.
Marketing mix. The four Ps: product, price, promotion, place. These are used to carry out a business' marketing strategy.
Marketing model. A framework for making marketing decisions in a scientific manner.
Marketing planning. Producing a schedule of marketing activities based on decisions about the marketing mix.
Marketing strategy. A medium to long term plan for meeting marketing objectives.
Marketing targets. Specific, measurable goals to be achieved within a limited time scale.
Marketing. The function that links the company and the customer to get the right product to the right place at the right time.
Mass market. A product which has mass appeal so can be promoted to all types of customer.
Niche market. A small, concentrated market which is often a section of a larger market.
Pan European marketing. Treating Europe as one market and selling the same product throughout.
Penetration pricing. Setting a price low to gain market share.
Pester power. The ability of children to pester their parents into buying what they want.
Portfolio analysis. Examination of all the products held by a firm to identify strengths and potential.
Price discrimination. Charging different prices to different people who receive the same product.
Price elasticity. Measure of how demand for a product changes with a change in price.
Primary research. Gathering of first hand data which is tailored to find exactly what the company wants.
Problem child. A product with a low market share of a high growth market.
Product awareness. This shows how many customers know about a certain brand. Market leaders such as Coca Cola may have 100% awareness.
Product differentiation. The extent to which customers perceive a product to be different to a competitors.
Product positioning. Deciding on an image for a product and therefore its target market.
Profit utilisation. How a company uses its profit after tax has been deducted.
Qualitative data. Collecting people's opinions including their thoughts and ideas.
Quantitative data. Collecting statistics and numerical data. Many people are asked to make it more accurate.
Quota sampling. Choosing people in proportion to their known demographic profile.
Random sampling. Choosing people so that every person has the same chance of being picked as someone else.
Revenue orientation. When extra sales can be achieved whilst incurring few extra costs.
Sampling. A group of people in a market research exercise who have been selected to represent the market as a whole.
Segmentation. How a certain market is divided up.
Star. A product with a high market share of a high growth market.
Stratified sampling. Choosing people from a specified group in the population.
SWOT analysis. An analysis of the strengths, weaknesses, opportunities and threats to a business.
Target market. The group of consumers a company aims its product at (can be wide or concentrated).
Trade exhibitions. Suppliers of a certain sector can display their products here for other companies to purchase.
Vision. An ambitious idea of where the business wants to be in the future.
Marketing contains many processes including:
- Selling products
- Advertising
- Market research
- Creating desire
- Consumer / organisations objectives
Each process contains a series of actions which produce a change or development. Marketing is essential for every business.
The chartered institute of marketing gives this as a definition:
"Marketing is the management process of identifying, anticipating, and satisfying customer requirements profitably"
Top of Form
Bottom of Form
A product orientated firm, focuses on the product itself for example it may look at what is easiest to produce rather than customers needs.
Advantages of product orientation:
Quality should be assured.
The product is consistent (any changes are progressive).
Future activities are more predictable.
Disadvantages of product orientation:
Don't respond well to change.
Fashions and tastes are not catered for.
Needs of the market are ignored.
A market orientated firm is one which concentrates on its market and continually identifies, reviews and analyses consumers needs e.g. the business will make the product available in quantities best suited to the consumer.
Advantages of product orientation:
Firm will respond better to changes in market.
Firm will understand customers' requirements better.
New products should be more successful for the company.
Disadvantages of product orientation:
Market research is expensive.
The future is unpredictable.
Asset led marketing takes the best from both product and market orientation. It doesn't only make decisions based on consumer needs but also product strengths. It uses the product name and brand image as a strength to market both new and existing products
Segmentation analysis is a way of dividing up a market to identify trends in it. Segmentation analysis is used to create a profile of the target market. The following can be taken into account when segmenting a market:
Age,
Gender,
Class,
Income,
Location,
Hobbies.
This information can help the company a lot with its marketing efforts. It can be used to set quotas on a market research exercise or be used to decide what promotional method is most appropriate for the market.
In general, the following are advantages of segmentation:
More efficient use is made of marketing resources - less waste.
A competitive advantage can be gained in a particular part of a market.
It's beneficial for small firms as uses less resources.
Products can be modified to be exactly what the consumer wants.
Marketing mix can be more targeted.
The following are disadvantages of segmentation:
Increased costs to develop variations of the product.
Higher stock holding costs.
Higher advertising and other costs.
Market size can be given in volume of product sold or value of products. This can therefore be calculated by adding all the different company's sales value or volume together. Market share can be used over time to show if a market is growing or declining.
Market share is the proportion (usually percent) of the total market held by one particular company. The company that has the biggest market share is known as the brand leader. Market share is a good measure of how successful a company is especially if it is measured over time and compared to close competitors.
The brand leader enjoys many benefits other than just more sales. It will get higher distribution level of its product (more shops will stock it) and it is able to offer lower discounts to retail outlets therefore receiving more profit.
Factors which effect the growth of a market are shown below:
Increase in spending power,
Increased population,
Social changes,
Changes in fashion,
Identifying customer needs.
Market research is the collection of data that will be of use to the company. This data is often about the company's customers but could also be about competitors' products or the whole market.
Market research can be carried out by the collection of primary and secondary data. Primary research is when the company collects its own data; for example a survey. Secondary research is using data which has already been collected such as a book of statistics. Secondary research is often much cheaper than primary research but primary research has the advantage that it can be tailored directly to the firm's requirements.
Two main types of data are collected by market research; these are quantitative and qualitative. Quantitative is generally numerical data such as statistics whereas qualitative data is people's ideas and opinions. Qualitative research is often used to investigate reasons why people buy a certain product. Group discussions (also known as focus groups) are the main way of collecting qualitative data whereas quantitative data is collected in simple questionnaires / surveys.
It would be impossible for a company to ask every single person in a specific market or even all of its customers so instead a sample is chosen. The purpose of a sample is to represent a large group of people with a smaller group of people, there are many advantages of using a sample: Saves time, labour and money.
Below are the types of samples:
Random: Everyone has an equal chance of being picked.
Systematic: Every Nth person within a group is chosen.
Cluster: People are chosen from a specific area.
Quota: Sample is selected on the basis of the characteristics of customer profile.
Stratified: Choosing people from a specific group in the population.
It is important with sampling that enough people are chosen to give confidence in the result. A sample size can be as low as 100 but obviously the more people asked, the more accurate the result obtained is.
Errors that may occur due to incorrect sampling may be caused by using the wrong type of sample or out of date statistics. Other errors may be due to questionnaire design or data analysis.
It is important that a questionnaire is carefully thought about and designed properly to obtain accurate data. Below are some rules for creating questionnaires:
Clarify the purpose of the enquiry.
The questions should be clear and easy to understand.
Avoid leading questions.
The questionnaire should follow a sequence and have a clear structure.
Avoid questions which people may not wish to answer or tax memory.
Include some control questions.
Once data has been collected, it can be presented in graphical form to make patterns more viable. E.g. graphs, pictograms, scattergrams, pie charts etc
Top of Form
Bottom of Form
Objectives are marketing targets which must be achieved so a company can meet its overall goals and are important for a business so that it knows where it is going for the future. Objectives need to be revised regularly and given a specific time scale. It is important that they are specific and measurable so that the company knows that it has met the objective. Objectives need to be achievable and realistic and also it must be remembered that they are no guarantee of success. It is important that objectives are communicated clearly to all the staff of a company and that the staff believe the objectives are realistic - if the staff do not believe in the objectives, they will not even try to achieve them. Unfortunately, not all objectives are achieved due to constraints which include internal constraints such as finance and external constraints that are beyond the company's control such as competition, fashion and the state of the economy.
Most firms see growth as their main objective - to increase market share so that one day they may be the market leader. But, other popular objectives include increasing product differentiation, continuity and innovation.
Objectives in proactive marketing include developing a new product, entering a new market, increasing sales and establishing greater market share.
An objective in reactive marketing is simply to manage and react to the effects of change and competition.
A company's vision is its overall aim for the future; objectives can help a company to achieve its vision.
Mass marketing is creating a product which appeals to all types of consumer. Mass marketing often ends up with the brand name being used instead of the product name e.g. Hoover not vacuum cleaner. Companies make use of global mass markets which means selling the same product with similar marketing techniques all around the world.
Niche marketing is aiming a product at a specific type of consumer. A niche market is usually a smaller segment of a larger market. Companies using a niche market often get less sales than they would if they aimed at a mass market so they have to make up for this by charging a higher price (as the product is often more specific to consumer needs, the customer is normally willing to pay more). It is easier for smaller firms to operate niche markets as there is less competition from bigger companies.
A product portfolio is used to examine all the products held by a firm to identify strengths and potential. An example of a product portfolio analysis is the Boston Matrix. The Boston Matrix is made up of a grid with 4 boxes in it as shown below:
stars
problem children
cash cows
dogs
Products in the top left box are known as stars and have high market share of a high growth market.
Products in the top right box are known as problem children and have low market share of a high growth market.
Products in the bottom left box are known as cash cows and have high market share of a low growth market.
Products in the bottom right box are known as dogs and have low market share of a low growth market.
The marketing mix consists of the 4 Ps: Product, Price, Promotion, Place.
The product is the most important aspect of the marketing mix. The product can be a service or even a holiday destination. Products have both tangible and intangible benefits. Tangible benefits include benefits which can be measured such as the top speed of a car. Intangible benefits are benefits that cannot be measured such as the enjoyment the customer will get from the product. It is important that the product is changed as necessary to bring it up to date and prevent it from being overtaken by competitors.
It is very important that the correct price is charged for a product. If the price is too high consumers will avoid the product as they will believe it to be too expensive yet if the product is priced too low they may believe that there is something wrong with the product for it to be so cheap. Also if the company charges too low a price, it may not cover its costs. There are many different pricing strategies that companies can use to decide on a price for their product including market and psychological pricing methods.
Once the product has been made and the price set, it is important that potential customers are told about the product. Promotion can also be used for reassuring the consumer that the product is of good quality and persuading them to purchase the product. Promotional methods include: advertising, direct selling, point of sale and incentives.
Place decides where the product is to be sold. There are 3 main distribution channels to choose from:
Traditional - selling the product to wholesalers who will then sell the product on to retail outlets.
Modern - producers selling the product directly to the retail outlet.
Direct - the producer selling directly to the consumer such as door to door sales or over the internet.
There are many types of new products including innovative, replacement, imitative and re-launched products.
New products are important to replace old products that have come to the end of their product life cycle. They help a business to obtain new customers.
There are 5 main stages in the development of a new product:
Generating ideas: Research, brainstorming, analysing other products.
Analysis: Looking at whether the ideas generated will be suitable.
Development: Creating product prototypes and initial testing.
Test marketing: Trial of a product in a controlled market.
Launch: Final launch of product after all problems have been solved.
Price elasticity of demand measures how demand changes in relation to a change in price.
The price elasticity of demand can be calculated by dividing the percentage change in demand and dividing it by the percentage change in price.
Price elasticity can be used to determine how much a company should increase / decrease prices to maximise profits.
Some products are price inelastic (even when price goes up, demand doesn't fall). These include petrol, alcohol and tobacco and are the main products that are heavily taxed.
Demand for a product can be controlled mainly by a company by changing price (the company could also use promotion and other tactics to gain extra sales). But, there are some factors that change demand which the company cannot control, which include:
Changes in customer income,
Competitors' activity,
Changes in taste and fashion.
Promoting a product can consist of:
Advertising: Billboards, TV, radio, newspaper etc.
Sales promotion: Competitions, discounts, coupons etc.
Publicity: Sponsorship etc.
Personal selling: Tele-marketing, presentations etc.
Internet.
It is important that the promotional method(s) chosen, suit the product. The following factors need to be taken into account when choosing a promotional method: nature of product, what stage the product is at in its life cycle and what funds are available.
These different types of promotion can be split into two main categories: above the line and below the line promotion.
Below the line promotional methods include:
In-store: Vouchers and special offers.
Loyalty card offers: Can encourage repeat purchases or encourage someone to purchase a product that they would not normally buy.
Competitions: Include both in-store and competitions on the back of packaging.
Packaging: Used as an 'eye-catcher' to attract the consumers' attention.
Above the line promotional methods include:
Press: Includes newspapers and magazines. Can be detailed and ad retained but little colour is available and ads don't stand out.
TV advertising: Very popular so ad can be shown to large audiences and can also demonstrate the product in use but there is a reluctance to watch ads and they are sometimes difficult to remember.
Radio: Many stations to advertise on and ads can be targeted if a radio station has a particular audience.
Cinema: Colour, sound can be used well on big screen and age group can be targeted but there is a limited audience and message can be short-lived.
Posters / billboards: Can be sited near shops for impulse buying and good for short punchy messages but give a limited amount of information and can be effected by weather and graffiti.
Internet: New form of advertising. It is easy to monitor and is cheap to set up but there is an uncontrollable audience.
Top of Form
Premium Pricing
Use a high price where there is a uniqueness about the product or service. This approach is used where a a substantial competitive advantage exists. Such high prices are charge for luxuries such as Cunard Cruises, Savoy Hotel rooms, and Concorde flights.
Penetration Pricing
The price charged for products and services is set artificially low in order to gain market share. Once this is achieved, the price is increased. This approach was used by France Telecom in order to attract new corporate clients.
Economy Pricing
This is a no frills low price. The cost of marketing and manufacture are kept at a minimum. Supermarkets often have economy brands for soups, spaghetti, etc.
Price Skimming
Charge a high price because you have a substantial competitive advantage. However, the advantage is not sustainable. The high price tends to attract new competitors into the market, and the price inevitably falls due to increased supply. Manufacturers of digital watches used a skimming approach in the 1970s. Once other manufacturers were tempted into the market and the watches were produced at a lower unit cost, other marketing strategies and pricing approaches are implemented.
Premium pricing, penetration pricing, economy pricing, and price skimming are the four main pricing policies/strategies. They form the bases for the exercise. However there are other important approaches to pricing.
Psychological Pricing
This approach is used when the marketer wants the consumer to respond on an emotional, rather than rational basis. For example 'price point perspective' 99 cents not one dollar.
Product Line Pricing
Where there is a range of product or services the pricing reflect the benefits of parts of the range. For example car washes. Basic wash could be $2, wash and wax $4, and the whole package $6.
Optional Product Pricing
Companies will attempt to increase the amount customer spend once they start to buy. Optional 'extras' increase the overall price of the product or service. For example airlines will charge for optional extras such as guaranteeing a window seat or reserving a row of seats next to each other.
Captive Product Pricing
Where products have complements, companies will charge a premium price where the consumer is captured. For example a razor manufacturer will charge a low price and recoup its margin (and more) from the sale of the only design of blades which fit the razor.
Product Bundle Pricing
Here sellers combine several products in the same package. This also serves to move old stock. Videos and CDs are often sold using the bundle approach.
Promotional Pricing
Pricing to promote a product is a very common application. There are many examples of promotional pricing including approaches such as BOGOF (Buy One Get One Free).
Geographical Pricing
Geographical pricing is evident where there are variations in price in different parts of the world. For example rarity value, or where shipping costs increase price.
Value Pricing
This approach is used where external factors such as recession or increased competition force companies to provide 'value' products and services to retain sales e.g value meals at McDonalds.
Pricing Strategies
Pricing is an essential part of any business strategy. Pricing creates the revenue
to support existing and future opportunities. While it is often assumed that the
goal of pricing is to generate the most revenue, there are a number of pricing
objectives businesses pursue, each leading to a different pricing strategy.
Pricing objectives include PROFIT MAXIMIZATION, market share or sales
growth, survival, targeted return, and price matching. The profit maximization
objective considers marginal revenue and marginal cost at various levels of
output. Price is determined by market demand at the level of output where the
extra (marginal) revenue from the last unit of output produced and sold equals
the extra (marginal) cost to produce that unit of output.
Market share or sales growth objectives lead managers to increase or decrease
price to obtain a specified level of sales. Penetration pricing, setting a low initial
price to stimulate sales and gain access to the market, is often associated with
market share or sales growth pricing strategy.
Sometimes a firm will desperately need cash in order to stay in business. In
these situations, previous pricing strategies are replaced with a survival strategy.
Prices are cut and discounts offered to generate enough revenue to stay in
business.
Targeted return objectives lead to markup and return on investment pricing
strategies. In markup pricing, a popular strategy used in wholesaling and
retailing, a standard amount or percentage is added to the cost of the product in
order to determine price. In many retail stores, keystoning, doubling the cost of
the product, is used. Percentage markups can be confusing. From a retailer's
perspective, if the cost of an item is $1.00 and they sell it for $2.00 this is a 50
percent markup. Logically, if you compare the change in price ($2.00-$1.00 =
$1.00) to the cost ($1.00), it would appear to be a 100 percent markup. But, by
tradition in the retail industry, you compare the change price ($1.00) to the sales
price ($2.00), which is a 50 percent markup.
Return on investment (ROI) pricing compares the expected income to the total
assets associated with the product or project. Prices are then determined based
on a target return on investment.
Price matching or competitive pricing is, as the term suggests, an objective to
keep prices consistent with competitors' prices. A price matching strategy leads
to non-price competition, where firms compete for customers based on service,
quality, promotion, product differences, availability, and basically anything but
price. Price matching is prevalent in markets where there are only a few
competing firms (oligopolies). Price matching reduces the potential for price
wars, severe reductions in prices matched by the other firms in the market. Price
matching guarantees are effectively used by some retail firms to reduce
consumer concerns about getting the lowest price.
Pricing strategy also involves psychological pricing and product life cycle pricing.
Psychological pricing considers how consumers' perceptions and beliefs affect
their price evaluations. Premium (or prestige pricing) uses high prices to convey
an image of quality to buyers. Odd-even pricing, the use of $9.99 rather than
$10.00, lead consumers to think of the product in the lower (ess than $10)
category rather than in the $10 to $20 range.
PRODUCT LIFE CYCLE pricing strategies recognize that products and product
categories generally go through a cycle, including introduction, growth, maturity
and decline. During the introductory stage, often there is only one firm in the
market, and higher prices are used to recoup initial expenditures. Also a price
skimming strategy, such high prices appeal only to those consumers most willing
and able to buy the product. During the growth stage prices are lowered as
competing products enter the market, and in the maturity stage prices are
lowered again as the market becomes saturated. During the final, decline stage,
prices are lowered to sell the final inventory.
As products go through the life cycle, the number of competitors fluctuates,
changing the nature of demand in the market. All pricing strategies must
consider demand, the willingness and ability of consumers to purchase products.
The LAW OF DEMAND states that as producers raise prices, the quantity
demanded decreases, and as they lower prices, the quantity demanded
increases, assuming nothing other than price is changed in the market. PRICE
ELASTICITY OF DEMAND is the degree or percentage response of consumers
to a price change.
There are also a number of ethical issues associated with pricing strategy. First,
the FEDERAL TRADE COMMISSION defines price comparison guidelines to
avoid deceptive price advertising. Retailers must be able to document their
claims about comparison prices. A second pricing issue is "bait and switch"
schemes, where firms advertise low-priced products but do not have reasonable
quantities of the product available for purchase, but they do have higher-priced
similar products available. Bait and switch practices are illegal. Third, predatory
pricing, the use of low prices to weaken and eliminate competitors, is hard to
prove but a controversial pricing strategy.
author
Key words bait and switch, predatory pricing, penetration pricing, target return
pricing, keystoning, markups, price matching, psychological pricing, return on
investment (Note to authors, key words are will be included in the encyclopedia
index. These are terms discussed in entries but not included as a separate
entry.)
Further reading:
Lamb, Charles, Joseph Hair, and Carl McDaniel, Marketing Cincinnati, Ohio, 5th
edition, 2000.
Bearden, William, Thomas Ingram, and Raymond la Forge, Marketing Principles
and Perspectives, Irwin McGraw-Hill, Boston, 2nd edition, 1998.
2. Price
Changing the product to reflect the product's life cycle is only part of the essence of a well balanced marketing mix, and so PRICE enters the second important consideration of the marketing mix. When setting a price on a range for your products, you need to ensure that you can recoup any overheads, compete with rival companies and charge a price your customers are willing to pay. To do this you need to fine tune your pricing policy and you could achieve this in a number of ways:
Loss Leader Pricing
This involves lowering prices on a number of key products in order to attract a customer to purchase the products. Customers obviously like a bargain and like may be attracted to buy this item even if they had never considered purchasing this item before. Price reductions could be used to entice customers to look at your other products, and any profit lost might well be made up should the customer be persuaded to shop around and purchase other produces not reduced in price. Loss leader pricing might be used to sell off or stimulate interest in products considered to be in the maturity or decline stage of their life cycle.
Penetration Pricing
This type of pricing is used for products identified as being in the "introductory" stage of the product life cycle to enable the product to get a foothold in the market. Prices are artificially reduced to attract the largest possible audience. It is often used to prevent or discourage competitors from capturing the market and used for products that are mass-produced.
Price Skimming
Where Penetration Pricing keeps the pricing below the real market price, price skimming raises the price artificially to enable it to quickly recoup costs and for immediate profit. This type of pricing structure works very well for products that are in demand or where there are few competitors - electronic equipment for example. Caution has to be used when employing this strategy as competitors may well take advantage of these high prices and enter the market quickly with a realistic price thus stealing the market. Again this type of pricing strategy might be used when the product is in its growth stage in the product life cycle as demand is high and sales are high.
Differential Pricing
This involves allowing the same product to be priced differently; this can be justified when the product is sold in areas with differing economic climates, when sold through differing distribution channels, to appeal to a different market segment. For example, you could choose to charge a wholesaler less for buying in bulk than for an individual who only bought on single card. you could also decide to charge more for your card designs in London than you would in the North of England simply because the economy is more stable in London than in the North of England.
Bottom of Form