From the results I’ve decided to use increments of 0.05kg, starting at zero, up to a maximum 0.5kg. This will give a reasonable range of results, to be plotted. With initial 0kg, the potentiometer will be in its initial position, and will therefore have a fixed voltage. It takes 10 weights to reach the maximum weight of 0.5kg and I have tested that these can all fit on the board without it tipping, which could seriously effect my results. After 0.5kg the large number of weights become unsafe and often fall off the board, despite small changes made like using a board with small sides.
What voltage should there be coming from the powerpack?
The powerpack, which is connected to the POT, delivering a DC voltage can be altered to give different input voltages, this effects the output reading. A small voltage means that it will take a large turn of the potentiometer for a readable change in the output voltage of the POT. As in my experiment the arm will not turn by much I need a input voltage which will give me readings which are far enough apart to be read and plotted accurately. I tested some readings at different input voltages:
These results supports my prediction that I need a high voltage, and shows that it’s the highest voltage available which gives the results that gives the widest range, I will therefore use 12V as my input voltage, to make it easier to detect changed using the available voltmeters.
Science
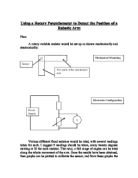
The potentiometer in this experiment measures how much the weighs turn the movable arm of the sensor.
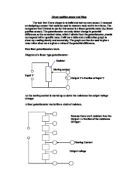
As the distance between the two points increases, the resistance increases; this is because the electricity has further to travel against the force of resistance. This is shown in the diagram below.
Therefore overall resistance is greater. The shorter the distance the, the less the resistance, using the same reasoning. This change in resistance, changes the output voltage, this is shown using the equation.
Resistance = Voltage / Current (R = V/I)
V = IR, so if: R , V also , as current stays the same.
Current stays the same
The POT sensor with a changing or variable resistor together with a fixed resistor, is exactly the same as a potential divider. As this diagram shows:
A potential divider is used to divide a potential difference into two or more smaller potential differences (hence the name). This is very useful in sensors, because as the sensor resistance increases, the potential difference across its (the output voltage) is the current multiplied by the sensor resistance (V = IR). This is proportional to the sensor resistance, because if that increases the current decreases. The result is that as the sensor resistance increases the output changes less and less, for each equal increase in sensor resistance. This is mirrored for potentiometers.
Taking that a POT is a self contained potential divider; the rule to find the output voltage in a potential divider is the same rule to find the output voltage in a POT.
The equation is derived from two firm rules:
V = IR
Voltage in = I(R + R )
If we rearrange Vin = to get I, we get:
The output voltage for R is:
If we now substitute Equation into equation , we get:
Or
Where
R = 5kΩ = 5000Ω
R = Variable weight
χ = Resistance of R
V = Output voltage.
In a POT: R is the variable, which is changed as the arm turns, R is fixed on the POT.
In this experiment the POT I am using has a fixed resistor of 5kΩ. This resistance is printed upon the POT during manufacture.
This formula only applies to the POT sensor while the springs attached to the board are obeying HOOKES LAW.
Hookes Law is the rule which shows how a spring stretches as you apply an increasing force to it, it states that force is proportional to extension.
So, force = spring constant extension
F = ke
This can be shown clearly in the diagram below:
When a great enough force is applied to the springs, they reach their elastic limit, this it the point at which they become permanently deformed, and their stretching no longer obeys Hookes law, they don’t stretch in proportion to load applied. This means the mechano arm doesn’t move in proportion to loads applied, so the POT’s arm is also not turned in proportion to load applied and thus the output voltage equation does not apply. IT ONLY works while the springs are obeying Hookes law, so during the course of my experiment All the loads need to remain below the mass needed to reach the springs elastic limit.
I tested my springs to show that they follow Hooke's law:
Method
Equipment
- POT Sensor
- Weights (0.05kg)
- Voltmeter
- Clamps (2)
- Springs (4)
- Powerpack
- Wooden board with four hooks in corners
- Mechano arm
- Small bolt and blue tack
Diagram
1) Set up the experiment as shown above. Making sure wooden board is horizontally straight, and supported by all four springs, adjust springs and clamps if not.
2) Turn on powerpack and switch to 12V, making sure mechano arm is resting on the board, and that the join between the arm and POT is secure, take reading from Voltmeter.
3) Carefully put on the centre of the board the first 0.05kg weight, when board and springs have become still and the arm is still, take reading from voltmeter. Record results in table.
4) Add further weights, making sure they're in the centre of the board and that the board is stable, if it tilts too much to one side, adjust weights. Record all results in table.
5) When all weights up to 0.5kg have been added, turn off powerpack and reset experiment. Repeat twice more, so 3 full result tables are produced.
6) Find the average of all 3 results, plot average on graph.
Methodology for finding properties of POT sensor.
Sensitivity
This is the ratio of change of output to change of input.
This is found by finding the gradient of my calibration curve:
Sensitivity = Change in V / Change in M
Resolution
This is the smallest change a sensor can detect.
This was found on a digital voltmeter (as voltage was my output), by the number of decimal points it gives the voltage reading to. For example:
0.4V, 0.8V, 0.5V….. Resolution = 0.1V, as a change of 0.05V cannot be detected.
Response Time
This is the time a sensor takes to respond to a change in input.
This can be found by measuring the time period from putting the weights onto the board to the voltmeter changing. The time would be measured with a digital stopwatch.
Analysis and Conclusions
Sensitivity = Gradient
Resolution
The digital voltmeter, took my output Voltage to two decimal places, I kept this resolution when entering my results and producing my calibration curve. The resolution therefor for my POT sensor is 0.01V.
Response Time
I timed the response time of my sensor using a digital stopwatch. I put at weight on, started the stopwatch and when the voltmeter changed, and was stable I stopped the watch. The table below shows my results.
The average of these results was 1.8 seconds, so this is the average response time of my POT sensor.
When I began my experiment I took one set of readings, I came across many problems while doing the experiment, and when I had collated these results there were many errors.
These can be seen in the table below.
One obvious anomaly occurs at 0.3 Kg,
The result for 0.3 Kg is lower than the output voltage for 0.25 and even 0.2. This ‘going backward', in results, is also seen at 0.1 Kg. Some of the results also seem to jump randomly and the difference between them is very varied. I decided to stop the experiment and try to discover what was causing the errors, change it then repeat the experiment again.
Possible causes of the errors were, the springs not being straight or obeying Hooke's law, the weights not being correct and the voltmeter not working properly. I checked all these and everything was working correctly. So, I came to the conclusion that the errors were probably caused by the wooden board tipping when a weight was placed on it. After observing the board while weights were placed on it I realised that this was the cause of the anomalous results. The board already had a slight tilt due to the force of the mechano arm on the board. For example:
This meant that the tilt of the bar was partly independent of the force of the weights acting downwards, thus meaning that the POT output was not totally caused by the weights.
To compensate for this I added a small weight on the opposite side of the mechano arm.
Another cause of the errors was the placing of the weights close to the edge of the board, again causing the board to tilt, and again meaning the output of the POT was not totally determined by the weights alone. For example:
To make sure that this didn’t effect further results I was careful in future runs to place the weights in the centre of the board, and to stack them carefully. To try and stop small tilts in the board effecting my results I repeated the experiment 3 times and took the average of all the results. This meant the other two results, cancelled out any small anomalies in one set.
My final calibration curve result had very few anomalies; the few that do deviate from the line of best fit (which is linear) could have been caused by small tilts in the board and in the arm as mentioned above. The tilt would have meant that the POT did not turn in proportion to the weight. But using the average of 3 results and with the addition of a line of best fit, these small errors are overlooked. The calibration curve produced, is actually a straight line, which means that the output is proportional to the input.
This proportional increase was due to the stretching springs obeying Hooke's law, as weights were added the strings stretched proportionally, so the arm would move proportionally to the weight, turning the POT also proportionally. The output voltage would therefor be proportional to the mass added, giving me the straight line from my calibration curve.
Overall I think this experiment was very successful and I fulfilled all the aims. The calibration curve produced was accurate as were the sensor properties of the POT I found. The method I used was a sensible and pertinent choice for the available materials and the time we had. There were a few improvements, which I would make to the experiment if I had the time and resources; these would include using a more sensitive voltmeter so my resolution would be higher. Making sure the board was perfectly straight at all times; this could possibly be done my using a spirit level, and adjusting the springs throughout the experiment, although this may have implications on the results.
A different set up could have been used, perhaps using different equipment; one idea would be to use a pivoting arm. The arm could be attached to the POT, which would be attached to a vertical bar; a spring could then be attached to one end and secured. Weights would be added to one side, making the arm turn as one side went down, thus turning the POT.
There are many more improvements, which could have given me slightly more accurate results, but as my line of best fit was a straight line already, these improvements would have altered the final calibration graph very little.
This type of calibration curve would be useful to manufactures of electronic scales, who may wish to use it to programme their products, it could also be used to compare the input against outputs in industry, for example checking electronic equipment.