Geography Project - South Wales iron works.
GCSE Geography Project
Rhys Griffiths 11B
Part 1: Introduction
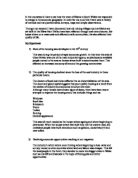
In 1860, at the beginning of the industrial revolution, there were 35 iron works in South Wales. Villages were totally dependent upon these works as they generated the income by which the population could survive. South Wales had the ideal location for making iron as coal and "blackland" iron ore were often found together on valley sides. Later, steel-making was to develop from the original iron industry.
Location of iron ore and coal works in South Wales 1860. (Waugh p. 112)
By the 1990s the industry had declined and only two steelworks were left in Wales. These were at Port Talbot and Llanwern, in Newport. The quality iron ore was now exhausted and coal was uneconomic to mine. As both these raw materials had to be imported, it was logical to build the modern steelworks on the coast to make it easier to transport the raw materials by sea, initially using the local docks but later the huge specially constructed harbour at Port Talbot.
Blast Furnaces at the Port Talbot Steelworks Nov. 2002
Why did the industries such as coal and iron decline?
The old industries declined for many reasons, one of them being that there was a change in fuels available. Oil and gas were increasingly being used for power which left less need for coal. Also the British Empire started to decrease which led to markets for coal collapsing. As other countries developed their own industries there was also more competition from abroad. In some cases they could do it cheaper and cost effectively. As well as that most people started to use gas for domestic fuel (cookers and central heating), and it became more attractive than coal.
As the iron, steel and coal industries declined, high- tech industries took over and business and science parks were built as part of inner city redevelopment schemes. "Footloose" industries were also brought in by the government.
Why are new industries attracted?
There are lots of reasons why high-tech industries were attracted to South Wales. A big attraction is that modern footloose industries were set up in this area because they have good access to the UK and the EU through good road and rail networks such as the M4 and the London- Paddington rail line. These made it easier to connect with airports and sea-ports. There are also services available such as police, health and fire services to assist with any emergencies. There is a pleasant environment for the employees of the industries to live and this will help to keep well qualified and skilled people in the area. The land is flat and cheap and sometimes green-field sites are made available which keep costs of establishing new buildings and developments low.
One of the biggest advantages is the attraction of government subsidies and aid grants. For example, the government provides aid by setting up Enterprise Zones (EZ) such as in Swansea, or Urban Development Corporations (UDC) such as in Cardiff Bay.
As well as these, Business and Science Parks attract companies to edge-of-city green-field sites which provide low cost land, a pleasant working environment and a low density of buildings. Business parks are ideal locations for research institutions and high-tech industries. Science parks are similar but have direct links with universities. Bridgend has a science park at Island Farm on the southern edge of the town. In Japan they have whole cities dedicated to this concept such as that the Tsukuba Science City.
The Logica company based at Bridgend Science Park.
All of the above ideas may assist in explaining why Bridgend seems to be divided into a wealthier south and poorer north. We can gain some insight into the reasons for this divide by comparing with the situation on a larger scale in countries elsewhere in the world such as Italy. In Italy there is a divide between the north and south where, in contrast to Bridgend, it appears that the north is wealthier than the south. Despite 60% of the population living in the south 80% of the gross national industrial product is produced in the north. This is due to the multi- national companies which are based there. On a world level there are also divides between the rich western countries such as the USA and the UK and poorer Eastern countries and between the poor Third World countries and the other affluent countries.
Part 2: Aims and Hypothesis
Aim
My aim is to investigate whether the quality of life is better in the north or south of Bridgend Unitary Authority.
Hypothesis
My prediction is that:
The people in the southern part of Bridgend Unitary Authority will have a better quality of life than the people living in the northern part.
I think this is primarily due to the industrial changes in South Wales. Some other reasons for the south having a better quality of life than the north are:
. There are more jobs in the south due to industry moving there.
2. As there are more jobs there is more money and therefore more incentive to work because the people in the ...
This is a preview of the whole essay
Hypothesis
My prediction is that:
The people in the southern part of Bridgend Unitary Authority will have a better quality of life than the people living in the northern part.
I think this is primarily due to the industrial changes in South Wales. Some other reasons for the south having a better quality of life than the north are:
. There are more jobs in the south due to industry moving there.
2. As there are more jobs there is more money and therefore more incentive to work because the people in the area know that there are more job opportunities for them.
3. There is also a lot of demand for better houses and facilities etc. as there is money to pay for them.
4. The south has a better quality of life because there are more facilities such as for leisure and healthcare.
While investigating my hypothesis I will be looking to answer the following questions from the sources indicated.
Question
Data Collection
Type of Data
Will there be a better environmental quality in the south of Bridgend County Borough?
Environmental quality survey as part of school field trip
Primary
Are there a greater number of non-earning families in the north of the borough
991 census data
Secondary
Do the people in the south have more expensive houses than the north?
Property News.
Photographs.
Secondary
Primary
Is there more crime in the north or the south?
Newspaper.
Visual pictures
Secondary
Primary
Who is the better qualified?
991 census data
Secondary
Who travels to work by car the most?
991 census data
Secondary
Part 3: Methodologies
Environmental Quality Survey
The survey I will be using has been developed by Nottinghamshire County Planning Department and is based on a points score system. The maximum score for an area is 70 which would indicate a horrendously poor environment for its residents. The minimum score of zero would indicate a perfect area. The survey observes four main elements of the environment:
* Appearance (20points)
* Accessibility (20)
* Pollution (15)
* Facilities (15)
Census Data
In my project I will be using the 1991 Census Data to help me find where the better quality of life can be found. The census is a survey taken every ten years which is an accurate compilation of statistics about the people in the UK. It is good for comparing things such as wealth, employment and mobility between the north and south of Bridgend. This could help me answer some of my questions and is particularly useful in providing quantifiable data.
Other Possible Sources
As well as using the survey and the census as sources of data I also intend to use some other sources of information. I will use:
* Information from the "Property News"
* Crime statistics, house prices and pollution reports from the website upmystreet.com and from "The Glamorgan Gazette"
* Photographic and field sketch evidence such as evidence of vandalism
Part 4: Analysis
Will there be a better environmental quality in the south of Bridgend County Borough?
On a fieldtrip around Bridgend we conducted an environmental quality survey. The results are illustrated below
From the graph you can see that the south scored between 11 and 25 points and the north between 40 and 43. This means that the south has a better environmental quality than the north. The north scores significantly better than the south in terms of this survey but there is evidence that the authorities are addressing this problem. For example, we observed the police applying strategies for cracking down on vandalism.
We also observed old boarded-up flats (shown in the photograph overleaf) in the process of being demolished and replaced with new, more modern housing in an effort to improve the environmental quality.
Boarded up flats at Llangeinor north of Blackmill.
The new houses at Llangeinor.
As well as attempting to attract more people with new housing developments, the council have been bringing in more jobs. The factory shown below used to be owned by a company called ACCO (American Clip Corporation) and has been taken over by Irvin GQ Parachutes and is being refurbished at the moment. I was told this by the security guard.
The ACCO Factory
The data from my survey shows the mean points score for the northern wards was 38.75 while that of the southern wards was 14. Furthermore, the worst ward was Ogmore Vale with 43 points from the north while the best was Brackla with 10 points in the south.
Are there a greater number of non-earning families in the north of the borough?
I have used the 1991 Census data to produce a divergence graph (Graph 2 in the appendix) and a choropleth map (Map 1 in the appendix). From these we can see that almost all of the north wards are high in their proportion of non-earning families than the south wards, and that the highest four wards are also in the north. The choropleth map illustrates their relative positions.
An example of the big difference is that Coychurch Lower has 5.0% and Blackmill has 41.1%. Blackmill has 36.1% more non-earning families than Coychurch Lower. This difference could be because there are less job opportunities in the north.
Footloose industries like Sony and Ford are located in the south due to a strong workforce and easy access to transport links e.g. M4, train tracks and airports. These companies need lots of employees. This means that people in the north have less chance of getting jobs because there is so much competition and they live further away.
The Ford factory in Bridgend
The mean percentage of non-earning families for the northern wards is 23.84% while for the southern wards it is 14.9%. The highest ward is Blackmill with 41.1% in the north while the lowest ward is Coychurch Lower with 5% in the south.
Who has more expensive houses?
I have collected some copies from the "Property News" for the Bridgend area to compare the prices of houses and I have discovered that the most expensive houses are in the south although there are some expensive houses in the north. A reason for the expensive houses in the north is that there are beautiful views as shown in the picture overleaf.
Ogmore Vale
If you compare two similar structured houses (see photographs overleaf) you see that the houses from the south are much more expensive. For example, we can compare two similar terraced houses.
In the South, in Coity Road, Bridgend, a modernized house priced at £84,950 with 2 bedrooms, a bay window and uPVC double glazing.
While in the North, in Victoria Street, Caerau, a house priced at £28,000 with 3 bedrooms and uPVC double glazing.
It costs £56,950 more to have a convenient spot and a modernised house in the south.
These two examples show that it is much more expensive to live in the south. But why do people still pay for these expensive houses when they can get them for almost half the price in the north? They do because of:
o More job opportunities
o Better and more leisure facilities.
o Travelling distances are less and roads more accessible
It is because of the above reasons that demand for houses in the south is greater than the north. Therefore the greater the demand the higher the asking price because people are prepared to pay for the ideal location.
South: Coity Road, Bridgend.
£84,950 with- 2 bedrooms, bay window and uPVC double glazing, modernised
North: Victoria Street, Caerau.
£28,000 with- 3 bedrooms, uPVC double glazing.
Is there more crime in the north or the south?
When I came to research my answer for this question I realised that I did not have that much information to answer it so I looked for crime statistics on the internet using upmystreet.com and the South Wales Police website. Unfortunately, I did not find any information which showed the contrast between the north and south. So I decided to investigate for myself and went out to see where I could find the most evidence of crime. My results showed me that the majority of crime was in the north. The pictures I took showed that more people in the north dumped their rubbish.
This picture shows that places in the north use bars to stop places being broken into and getting vandalised.
When in the north I was expecting to see a lot of crime but was surprised of how little I found. I spoke to some police men and asked them if there was any criminal damage around that I could look at and they told me that the police have new strategies to combat the dumping of rubbish/cars and graffiti. I was told that the strategies in place were to remove any graffiti and cars when found, immediately. Therefore discouraging more crime which is why I could find little on that day. However I found one car that had been dumped. (See overleaf)
Abandoned car
Although the north had more crime the south had a fair share of it. As these pictures show, there were vandalised buildings.
The picture below shows a disused petrol station and car sales in Wildmill. It had too many damages to repair and became derelict, also in Wildmill we found a number of derelict flats with windows boarded up with metal sheets.
Disused petrol station
Graffiti at the back of the Physique gym in Brackla.
Who is the better qualified?
Again I have collected data from the 1991 Census showing higher education qualifications and produced a choropleth map (Map2) and a bar graph (See below).
From these we can see that 10 of the south wards (in blue on the bar chart) have considerably more higher education qualifications than all of the north. But 6 of the south wards are in the same range as the north.
One example of the south being far better qualified is that in Porthcawl West 20.9%, have higher education qualifications while in Llangynwyd only 10.5% have. That's a 10.4% difference. On the whole the south was predominantly greater that the north, but in some cases the north was better than the south such as Llangynwyd, with 10.5% and Pyle with only 5.6%.
If you look at the choropleth map you can see that it shows clearly that most people with higher education qualifications live in the south or that most of the least educated are in the north. This could be due to the fact that those with better qualifications have been able to take up the job opportunities in the south of the borough and due to improved incomes have been able to choose to live in the south which is nearer to a) their employment b) better and more attractive housing c) better facilities.
The mean percentage of people with higher education qualifications in the north was 5.7% while in the south it was 13.99%. The highest ward was Porthcawl West with 20.9% in the south and the lowest was Caerau with 2% in the north.
Who travels to work by car the most?
To find the answer to this question I used secondary data in the form of the 1991 Census which I used to make a bar graph (See next page) and a divergence graph (Graph 3). These graphs do not show much difference between the south and the north. But the top 8 wards are from the south. This may mean that people in the north work closer to home.
For example in Brackla 12.5% more people travel to work by car than in Bettws. The proportion of people with higher education qualifications in these wards is 20.4% and 2.7% respectively. People with good qualifications are more likely to take up job opportunities not only in the borough but throughout South Wales while many of those without similar qualifications will have local low paid jobs or no jobs at all. Those with good jobs will need transport and will also be able to afford cars. For those in some of the northern wards a car is essential to access job opportunities and the facilities which are more available in the south of the borough.
My evidence shows that the people in the north travelled to work by car more than the people in the south. However, there is not much of a difference between the two areas. The 1991 Census data indicates that the mean percentage of people travelling to work by car in the south is 68.95% while it is 70.41% in the north.
Part 5: Conclusion
Will there be a better environmental quality in the south of Bridgend County Borough?
My findings from the environmental quality survey indicate that the better environmental quality is found in the south of Bridgend County Borough.
The mean points score for the northern wards was 38.75 while that of the southern wards was 14. Furthermore, the worst ward was Ogmore Vale with 43 points from the north while the best was Brackla with 10 points in the south.
Are there a greater number of non-earning families in the north of the borough?
The evidence I have collected has shown that there are more non-earning families in the north.
The evidence to support this is most significant from the 1991 Census which indicated that almost all of the north wards are higher in their proportion of non-earning families than the south wards and that the highest four wards are also in the north. The mean percentage of non-earning families for the northern wards is 23.84% while for the southern wards it is 14.9%. The highest ward is Blackmill with 41.1% in the north while the lowest ward is Coychurch Lower with 5% in the south.
Do the people in the south have more expensive houses than the north?
My comparison of house prices suggests that it is true that the more expensive houses are in the south.
Evidence to support this is based upon the large number of expensive houses which are advertised for sale are in the southern wards. Also a comparison of comparable properties (i.e. those with similar specifications) advertised for sale indicated that they were significantly more expensive in the southern wards.
Is there more crime in the north or the south?
I have found that there is more crime in the north than the south.
I do not have very much evidence to support this, but I have used pictures and newspaper cuttings to try and prove what I have said. Based on these I found crimes committed in the north and in the south. Although my sample is small I believe that it is correct as it helps prove my hypothesis.
Who is the better qualified?
The people living in the southern wards are significantly better qualified than those in the northern wards.
Again I have used data from the 1991 Census as evidence. 10 of the south wards have considerably more higher education qualifications than all of the north. The mean percentage of people with higher education qualifications in the north was 5.7% while in the south it was 13.99%. The highest ward was Porthcawl West with 20.9% in the south and the lowest was Caerau with 2% in the north.
Who travels to work by car the most?
My evidence shows that the people in the north travelled to work by car more than the people in the south. However, there is not much of a difference between the two areas.
Evidence to support this is taken from the 1991 Census. It shows that although the top 8 wards are from the south, the mean percentage of people travelling to work by car in the south is 68.95% while it is 70.41% in the north.
Summary of Calculations
North
South
North
South
Mean
Mean
Highest
Lowest
Worst Environmental Quality
38.75pts
4pts
43
0
Non-earning families
23.84%
4.9%
41.1%
5%
House prices
Higher Education Qualifications
5.7%
3.99%
2%
20.9%
Travel to work by car
70.41%
68.95%
---
---
Overall Conclusion
My overall conclusion is that the answers to the questions I posed indicate that the south comes out better in nearly all of the issues studied. My hypothesis is therefore true.
The people in the southern part of Bridgend Unitary Authority will have a better quality of life than the people living in the northern part.
Part 6: Evaluation
I feel that my data was relevant and accurate to answer most of the questions I posed especially that of the 1991 Census. However, in making my judgements I need to bear in mind that the statistics extracted from the census were from 1991 and are therefore quite out of date. It would have been better for me to have used the most recent census of 2001.
The data collected from the environmental quality survey was useful in that it gave me quantifiable data to judge what would otherwise be subjective issues. By using quantifiable data in this way it helps to avoid any bias in my judgements. It was also recently collected data. (Autumn 2002)
My greatest difficulties were in addressing the issues on crime in the borough as I was unable to obtain statistics about the amount of crime committed within each ward or by the people living in each ward, so I have taken pictures of crime (e.g. graffiti, dumped rubbish and abandoned cars) that I could find and studied the local newspapers for crimes committed, I used this to produce a suitable answer to my question "Is there more crime in the north or south?". I still think my sample was too small but this could be improved upon if I were to investigate in more depth. If I were to further my study I think I would conduct a survey or investigate in more depth the crime rates of the north and south of Bridgend. It was difficult to avoid bias in this case as statistical evidence was not available.
My analysis of property prices was based on a limited sample. I feel that a more thorough analysis of the property market would have given me stronger evidence for my claims. This would have meant using a much larger sample of comparable properties.
The issue of people travelling to work was not conclusive. In addition there are a variety of reasons why people would use cars to travel to work and many of those reasons will not necessarily indicate a better quality of life.
Part 7: Appendix
These are the incidents in the south:
Here are the incidents in the north
Part 8: Bibliography
Waugh, D. (1994) The Wider World. Nelson.
991 Census.
Property News.
The Glamorgan Gazette.
The Recorder.
Original Data