Chapter 2: Pedestrian Counts.
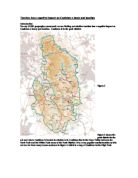
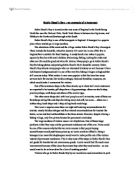
I feel that it is important to conduct a pedestrian count because one of my hypotheses is that Lytham attracts swarms of visitors. Also by finding out how many visitors Lytham attracts we can give a more accurate answer to the question is Lytham a ‘honey pot’ or not.
In my group, which was a two, we were based as position six (marked on the map). The method which my partner and I used was that we each went on opposite sides of the road and counted the number of people who walked past us to and from the mosaic in Lytham square (marked on the map).
After the 5 minutes was up my partner and I collated our information so that we had the total number of pedestrians that walked down the street to and from the mosaic. There were two pedestrian counts one in the morning and one in the afternoon and the times are as follows:
- (am)- 10:00- 10:05
- (pm)- 01:30- 01:35
Here is a table of the results from my partner and myself:
I feel that my partner counted more pedestrians than me because he was on the side of the road closest to Lytham centre, therefore more of the people were walking on his side because they were going to or from Lytham’s main street.
Here is a photograph of me conducting the pedestrian count:
When we went back to school we collated are results as a class, so that we could find out if the other groups found the same as us.
Here is a table to show the number of people travelling to and from Lytham town centre after the class had collated the results:
I feel that this table shows that more people travel to and from Lytham in the afternoon because of the following reasons:
- The count was taken around lunchtime therefore people were on there lunch break and going to nearby shops such as Burtons for their dinner.
- People who do not live near Lytham are more likely to set off around ten or eleven o’clock, so they will arrive around one o’clock.
- Some people who live in Lytham will still be in bed when the first survey was conducted and therefore came out later.
- In the morning the weather was cloudy and overcast but in the afternoon it cleared up and the sun came out.
Also by looking and the results and looking at the number locations on the map you can see that the further away from the central business district you go the less people there are. This is because most of the shops in Lytham (as in most towns and city’s) are in the centre of the town.
There were no real problems in my pedestrian count but if I was to do it again I would make sure that it lasted for 10 minutes rather than 5 minutes this is because we could get more wide spread results. I would also like to go back and conduct the same pedestrian count but over a longer period of time for example 1 week so that we could see which day would be the busiest. If I were to do this I think that Saturday would be the busiest day because most school children go out on Saturdays and some people come to Lytham for weekend breaks, Sunday would also be busy if we conducted the investigation by the church because most of the residents of Lytham will attend mass at St. Peters Church.
If I had to say whether Lytham was a ‘honey pot’ at this point due to the pedestrian count results I would say ‘yes’ because the results show that people visit Lytham for its shops and I know this because the is larger numbers of people near the central business district.
I have constructed a Spearman Rank Graph to show that the further away a town/city is from Lytham the less people from that area travel to Lytham:
Chapter 3: Parking and Accessibility / Traffic Survey
Traffic Survey
The traffic survey was done in the same was as the pedestrian count, my partner and myself each went on one side of the road and recorded our results in a table similar to this:
The reason I used a table like this is because it is easy to use and data can be collated easily by using it. The full headings are as follows:
- Bicycles
-
Motorbikes, scooters and mopeds.
-
Cars (Including three wheelers)
-
Light vans and minibuses
-
Heavy vehicles, lorries, buses and coaches.
The problem with using this method is that you can not always decide which category to put a vehicle under, for example: I may class a post van as a ‘light van’ but my partner may have put it down as a ‘heavy van’. But I think that if we had a list of each type of vehicle it would become to complex and the main aim of this investigation is not to find out about vehicles, so as long as the post van has been counted as one of the two vans it does not really matter.
If I were to do this investigation again I would improve this survey by changing the categories to:
- Bicycles
- Motorbikes, scooters and mopeds.
- Cars (including three wheelers)
- Delivery vans
- Buses
- Coaches
- Minibuses
By making the above changes I believe that the results from the traffic survey would be more accurate and give me more information.
As with the pedestrian count I would like to count the traffic for longer periods of time so that I get a better idea of the traffic flow.
After each group had completed their traffic survey we decided to collate our data in the same was as we did the pedestrian count.
Here is a table to show the amount of traffic in Lytham between 10:10-10:20am and 1:40-1:50.
The above table shows a volume of traffic at each point on the map, i.e. the first row of results is point one and the sixth row it point six on the map.
- Here is a graph to show the volume of cars in the morning and the afternoon:
As you can see from the graph there is a greater volume of cars in the afternoon at points 3,4,6,7,10,13 and 14 this is because these points are the main roads leading into and out of Lytham town centre.
There is a greater volume of cars in the morning at points 1,2,5,8,9,11,and 12 because these points are mostly in the centre of Lytham and the large number of cars is properly due to people travelling to work.
Here is a photograph of some of the traffic in Lytham:
In and around Lytham there are five car parks and these are used to reduce the amount of cars parked at the roadside and therefore hopefully reduce the amount of road congestion.
On my map the car parks are marked using a series of red diagonal lines.
In my survey one of the questions I asked was, if you came by car, where did you park.’
Here is a table to show the response that I got:
The table shows that most of the people I asked used one of the local car parks which is good for both reduced congestion and Lytham’s economy.
The charges to park at one of the car parks is as follows and they use a pay and display method:
Up to 1-hour 40p
1 to 2 hours 70p
2 to 3 hours £1.00
3 to 4 hours £1.30
Over 4 hours £2.10
I think that these prices are reasonable and can be afforded by most people, here is a photograph of the parking prices to back up my information:
To show the results more clearly in the table on the previous page I have put them into a graph.
- Here is a graph to show where visitors to Lytham park their car.
The graph shows that car parks are by far the most popular parking area for visitors to Lytham.
Here is a photograph of a car park, close to the centre of Lytham:
After looking at the above results it seems as if Lytham has a good traffic flow but does not get congested which is important, because people will return if the traffic flows well, this is because no one wants to sit in a traffic jam for hours when you are supposed to be relaxing.
Chapter 4: Testing of Hypothesis and Data Interpretation
Here are the Hypothesis’ that I set at the start of the investigation, I’m now going to take each one separately are prove whether they are true (T) or false (F).
These hypotheses are as follows: Lytham,
-
Attracts ‘swarms’ of visitors T
-
Has attractive scenery T
-
Has places of historic interest T
-
Caters for people with more leisure time T
-
Provides ample car parking space T
-
Lies in close proximity to several self-catering caravan parks / holiday villages T
-
Advertises in brochures, magazines and newspapers T
-
Can provide hotel / guest house accommodation T
-
Once people have visited Lytham they come back T
-
People who visit Lytham are mainly over 50 T
-
Most people who visit Lytham are middle class T
-
People visiting Lytham are mainly female T
-
Has shops providing specialist or tourist commodities F
By finding answers to the hypotheses above I should be able to give a more accurate statement to say that Lytham is a honey pot.
I also need to try and find out if the visitors create:
-
Parking problems No
-
Traffic congestion No
-
Crowding No
-
Litter No
Are the four above statements True or are they False?
When my group returned to school we compared and collected our answers from the questionnaires so that we each had more accurate results, for example I questioned fifteen people but when the group collated all of the results we had a group total of eighty-one which in my opinion is far more accurate.
Here is a results table to show my results from the questionnaires after they had been collated with my team members:
I will be used the above table in conjunction will other information I have collected and use it to find out whether the hypothesis I set at the start of the investigation are true or false.
- Lytham, attracts ‘swarms’ of visitors
In order to find out whether Lytham attracts swarms of visitors I will have to use the following sources of information:
- Pedestrian Count
- Traffic Count
Using the pedestrian count results below I can say that there were 772 people counted in and around Lytham’s town centre in two five minute time slots which suggests to me that there was a large number of people in Lytham because 772 people were spotted in 10 minutes and if the count was conducted for a longer period of time there would have been more people arriving in cars and on public transport who would have also been counted once the walked into Lytham.
Using the traffic survey table below I can work out the total amount of traffic in Lytham (approx) between the times of 10:10-10:20 and 1:40-1:50 and then decide whether I felt that there is a large amount of traffic in Lytham:
The above table shows that there were a total of 1642 vehicles counted in Lytham in two separate ten minute time slots, 1332 of which were cars and this suggests to me that there were a large number of visitors in Lytham because 43 out of 81 people in my questionnaire said that they travelled to Lytham via car.
Knowing all of the above information I feel that Lytham does attract swarms of visitors because there was a high volume of traffic and people in a small space of time and if we would have counted for a longer amount of time the numbers would keep on increasing suggesting even more that Lytham attracts swarms of visitors.
There were no questions on my questionnaire about the scenery in Lytham but I have taken some photographs of the area in and around Lytham town centre to show that the area is attractive and clean.
Its residents also refer to Lytham as ‘Leafy Lytham’, which as the name suggests is thought to be clean and have a large number of trees and other types of attractive scenery in order to encourage people to visit the area.
Here is a photograph of the gardens around Lowther Pavilion:
Lytham is also taking part in an event called ‘Fylde in Bloom’ which consists that the local area being brightened up with flowers and hanging baskets.
These hanging baskets are hung outside every shop in Lytham’s high street and are watered on a regular bases to keep them in top shape.
- Has places of historic interest
Lytham windmill is a place of historic interest in my opinion and was visited by 8 of the 81 people I questioned. Even though the windmill does not attract many visitors I feel that the reason for this is that it is located a good ten-minute walk from the town centre and on windy days it may not seem worth the walk.
Here is a photograph of a sign in Lytham advertising the lifeboat museum that is also a place of historic interest and like the windmill it is located on Lytham green:
- I have constructed a pie chart to show where the windmill ranks in relation to other attractions in Lytham:
After looking through the results on the previous page I feel that Lytham does have places of historic interest but these places do not attract people to Lytham but people visit them if the weather is nice and they are already in the area.
- People who visit Lytham are mainly over 50
In my survey I asked the pedestrians how old they was and just like I thought 65% of the 81 people I asked were over the age of 50.
Here is the question that I asked and the response I got from the public:
The table shows that 31 people were aged between 50 and 65, which is the largest amount of people in one age group.
The reason I believe that there are no entries into the age group of 0-18 is because people in this age category would be at school or college.
Most of the people were over the age of 50 because they would be retired and come to Lytham for the shops and to visit friends and family who live near by.
I also think that the 18-50 age gap was rather large but this does not matter because I was finding out if people were over 50 and if they are not it is irrelevant how old they are.
- Here is a graph to show the different ages of people I interviewed in Lytham:
The above graph shows the information in the table in a much clearer format.
- People who visit Lytham are mainly female
I though that it would be interesting to find out if more females visited Lytham than males, so in my questionnaire I decided to find this out by noting down their gender in the same way I noted down their answers.
Here is a table similar to the one in which I recorded my answers:
The table shows that 46 of the 81 visitors of female and when converted to a percentage it is 57% which is higher than the male percentage of 43% so there are more female visitors than male visitors by 11 people which is equal to 14%. I think that the reason most of the visitors to Lytham are female is because they are going shopping and men don’t really enjoy this.
- Most people who visit Lytham are middle class
In the same way I asked the pedestrians their age I also asked them if they would tell me their average yearly income because I believe that most of the people who visit Lytham are middle class. I split the possibilities into four categories up to a total of £30000 because I would say that people who earn over this amount are not really middle class.
Here are the results from my question:
The table shows that £11000-£20000 and £21000-£30000 have equal amounts of people earning this amount of money which I personally would call middle class and therefore most people who visit Lytham are middle class in my opinion.
- Once people have visited Lytham they come back
Another question that I asked was, ‘Is you’re your first visit or are you returning’ and the response, which I got, was again the same as what I predicted. I thought that most people would return to Lytham maybe because they live in close proximity to Lytham or they enjoyed their stay and wish to return.
Here is the response I got from the question, ‘Is this your first visit or are you returning’.
The fact that 69 out of the 81 visitors are returning to Lytham strongly suggests that once people have been to Lytham they enjoy returning.
It also shows that Lytham does attract swarms of visitors and at this point in the investigation I think that Lytham is a ‘honey pot’.
- Lies in close proximity to several self-catering caravan parks / holiday villages
Lytham lies in close proximity with Ribby Hall Holiday Village and is about fifteen minutes drive from the town centre.
Only 2% of the tourists to Lytham are staying at a holiday village or Caravan Park and I think that the reason for this is that most tourists who stay at caravan parks are in their late thirties and have children who will come in the summer holidays when they are off school. I can back up this information because I went to Ribby Hall and asked if they had a lot of summer holiday booking and they said that they were fully booked up for most of the six weeks.
- Advertises in brochures, magazines and newspapers
Lytham advertises in brochures like the one below, the reason it does this it to attract attention and if Lytham council publish the brochures themselves they can charge local businesses such as Ribby Hall to advertise which is good for the local economy.
In Lytham’s information centre you can pick up lots of different brochures and leaflets about Lytham and forthcoming events in the future, the site of the information centre is in Lytham square.
Here is a photograph of the information centre:
- Provides ample car parking space
Lytham has four main car parks which I feel are fairly cheap to use, two of these car parks are located in the town centre and the remaining two are situated on the sea front next to Lytham green. (Car parks are red diagonal lines on the map).
The majority of people who came to Lytham by car used the car parks the exact number from my questionnaire is 67%, which I feel is fairly high considering that only 12% of the cars in Lytham were parked on the roadside.
Here is the table that I used:
I have transferred the information in the table on the previous page on to a simple to read graph so that the results can be seen more clearly.
- A graph to show where in Lytham visitors parked their car.
The graph clearly shows that most visitors to Lytham used the car parks provided, I’m not sure if the other tourists used the roadside because the car parks were full or because they did not want to pay, but when I took my photographs the car parks were not full. So I think that Lytham does provide ample car parking space for tourists.
- Has shops providing specialist or tourist commodities
Lytham has a large number of different types of shops from food outlets to large service shops; below I have constructed a table to show the different types of shops in Lytham.
Using the above table I have decided that there are no real tourist shops in Lytham where visitors can buy souvenirs but there are shops, which attract visitors such as ‘Lanigans’ fishmonger.
There is a tourist information centre in Lytham Square that provides helpful information in the form of leaflets and broachers for tourists.
- Can provide hotel / guest house accommodation
Lytham does have hotel accommodation on the sea front if tourists wish to stay in the area, but most visitors who are staying for the weekend prefer to stay in Blackpool because this is where all of the entertainment and nightlife is.
I believe that Lytham can provide guesthouse accommodation but it is not to their advantage unless retried couples would like to spend a peaceful weekend together without the noise and troubles of nearby town Blackpool.
- Caters for people with more leisure time
I think that Lytham does cater for people with more leisure time as it provides local football, cricket and golf clubs, which are open to all ages. The golf course, which is called ‘Lytham Green Drive’, has a large number of members and some people travel long distances to play there.
The cricket club is open to all ages and sometimes hosts large tournaments at which counties such as Lancashire compete at the highest level.
I think that Lytham does cater more for people with more leisure time but also provides facilities for people with less time to spare.
I also need to try and find out if the visitors create:
- Parking problems
- Traffic congestion
- Crowding
- Litter
Are the four above statements True or are they False?
The visitors don’t seem to cause parking problems in my opinion because when I was walking past the car parks there were plenty of parking places available.
In my survey I asked tourists where they parked their car and 67% of them said that they used one of the four car parks in Lytham suggesting they a low number of cars were parked on the roadside causing congestion.
I did see one or two cars parked on double yellow lines and feel that these people could not be bothered using the car parks and should get a parking fine. A lot of the area in and around the town centre has double yellow lines, which I think is good and keeps traffic problems to a minimum.
When I went into Lytham there was no traffic congestion in the town centre and this surprised me due to the large volume of traffic in the area. I think that a lot of the residents of Lytham have walked into town or used the public transport, which I found out was 26% of the people I asked and I believe that this is good because most of the people I questioned were tourists and came by car.
There was no crowding in Lytham but I think that the reason for this is that I conducted my field work on a school day and I think that if I did it at the weekend there would be a lot more people.
When I went into the information centre I asked the assistant if Lytham every got congested and she told me that on ‘Club Day’ the area was full of people and is the same each year. I also think that in the summer when the weather is warm and dry Lytham will attract more visitors and crowding problems may occur.
There are no litter problems in the area and I think that the council have taken special thought to place litterbins in the area for tourists and local people to dispose of their rubbish.
In some streets there is chewing gum stuck to the floor and I think that this is because most people think that it is biodegradable, not even taking a second thought to look for a litterbin, but the problem is that chewing gum does not rot away.
I think after analysing the above data that Lytham is a ‘honey pot’ because it does attract ‘swarms’ of visitors and meets the demands of almost all of hypothesis I set.
The only doubts I have are that some of the people I asked live close by and I found out that 49% of the people I asked were residents of Lytham.
It has a large number of shops for tourists to use and cafes are situated down the high street if people get hungry and I also think that Lytham is better for older people as Blackpool has more facility’s for the youth and as I found out in my questionnaire 73% of the people who I asked were over the age of 50 years.
Chapter 5: Evaluation of Methods used to Collect Data
I think that the results, which I received from the pedestrians in Lytham, are accurate but could be made far more reliable by making some changed to the ways in which the information was collected and also the amount of times we went into Lytham.
The ways in which I conducted are questionnaire, could be made more accurate by asking more questions and if the people live in Lytham I will not ask them the remaining questions as they will obviously come back to Lytham and this will cause my results to be inaccurate and increase that chances of me coming to the conclusion that Lytham is a ‘honey pot’ when in fact it may not be.
Here a four questions which I would like to ask if I was to do this investigation again:
- Do use live in Lytham or within ten miles (approx) of the central business district?
- How many times have you previously visited Lytham?
- Have you come to the area specifically for Lytham or are you staying nearby and just having a look around the area?
- How did you hear about Lytham?
The reason I have chosen the above questions are
Question 1: The answer to this question will determine wheatear the person is classed in my opinion as a tourist or someone who lives near Lytham and just comes because they live there and I want to find out if people have travelled to Lytham from a long distance (more than 10 miles) because it attracts them.
Question 2: This will tell me how popular Lytham is for tourist, but they will only answer this question if they live more than 10 miles away.
Question 3: The answer to this question will tell me if it is actually Lytham that has attracted them and not the nearby town of Blackpool.
Question 4: This will tell me if they have friends who have also been to Lytham or if its because of the nearby caravan park of Ribby Hall, it could also be that Lytham advertise in brochures and magazines and I set this question in my hypothesis.
I would change the traffic count by increasing the time we counted the traffic to around thirty minutes and increase the frequency that it occurred from once in the morning and once in the afternoon to around three times in the morning and three times in the afternoon. A very effective way of finding the volume of traffic would be to use an automatic traffic counting machine that would continuously count the traffic for a week, by judging how many vehicles passed over it. The problem with this idea is that it would not be able to distinguish between the different types of vehicles. So I think that by increasing the number of times we used the traffic survey and increased the length of time they lasted I would have more accurate results because they would be spread over a wide range.
If I was asked to do another pedestrian count I would still use the same method as in this experiment because I feel that it is accurate but I would like to increase the time like in the traffic count so that I had a wider range of results. I also think that it would increase the reliability of the results if we conducted the count each day for a week as this way we could also find out which day is the busiest and if the weather changes how this also affects the number of people who travel to Lytham.
I would also improve the investigation as a whole by putting one person from each group in a different place in the Lytham area so that instead of having 14 points on the map collecting data we would have 28 points collecting data and this in the same was as the other changes I have made would increase the amount of data I collect therefore increasing the reliability and accuracy of my results.
I think that the results I have are reliable for the methods that I used to collect the data but if I made the above changes I believe that the results would be more reliable because I’m collecting them in a more accurate way.
I think that the questionnaire has reliable because unless the person lied when answering, (which I doubt very much) they were just answering questions, which I had set, and most of them were multiple choice so that when I collected they data it was easier to collate and to show in tables and graphs.
The traffic count also had a reliable method which was simple to understand and whilst at the same time being fairly accurate. The problem was that each group collated their data with everyone and even though I know that my partner and myself collected out data correctly and accurately I’m not totally sure that the other thirteen groups did the same as we did.
The pedestrian count worked in much the same was as the traffic count and I’m not sure if the other groups recorded the information accurately.
One of the problems I encountered when performing the pedestrian and traffic counts was that some vehicles/people walked past more than once which resulted some people being counted twice but some of the other groups may have counted these people only once, so next time I would have to make all of the possible outcomes clear to each separate group so that we all used the same method.
I think that the accuracy of my results is fairly high because in the pedestrian and traffic count there were groups counting traffic at 14 different points around Lytham which means that we got results from all around Lytham and not just the central business district. When I was writing conclusions for my results I used more than one source of information so that if I had made a mistake the two types of data would be different and I would spot my mistake, for example when answering the hypothesis ‘Do visitors create traffic congestion’ I used my questionnaire questions:
- If you came by car where did you park?
and
I used my traffic survey data in conjunction with the answers to the above questions so that I could give the most accurate conclusion possible.
By doing the above for each of the hypothesis I believe that I made all of my results as accurate as possible considering that the data I collected in the first place was also accurate and true, which I know, for my group it is.
I think that the results I have are valid for the time of year at which this investigation was carried out, but I think that in the summer there will be more visitors to Lytham because this is when most people go on holiday and also of people will spent time at Ribby Hall and visit Lytham for a day out. In the winter I think that there will be less visitors to Lytham because the weather can be rainy, overcast and windy which I feel would leave the visitor feeling miserable.
I also think that at the weekends there will be more tourists in Lytham because most of the tourist will be working in the week and come to Lytham on their days off.
The conclusions to which I have come to, are valid in my opinion and they are accurate, I also think that if I make the changes that I have talked about above the results which I record will be different but I think that all of the conclusions will be almost the same as they are now. This is because the basic principles are the same but I’m just increasing the length of time the investigation lasts so that I get a wider range of results.
The photographs, which I have taken, are reasonable and I think that they are of relevance to the investigation, but I would have liked to take more so that I could back-up my results more, the problem was that my camera ran out of film.
I have also tried to back up my information with brochures and leaflets, which I acquired, from the information centre the site of which is in Lytham Square.
Overall I think that the investigation went according to plan but I feel that not all of my results are entirely accurate because some of the people I asked were residents of Lytham and therefore there answers would not be the same as the answers of a tourists so if I was to redo the experiment the first question I would as would be, ‘Do you live in Lytham or within 10 miles of the town centre?’
Apart from this, I’m happy with my results and the outcome of the investigation is somewhat how I expected it to be before I started.