I wrote this information down on a sheet and have looked at any anomalies and any common occurrences, E.g. If someone visited everyday they generally knew were every shop was located whereas someone that only visited rarely, didn’t have any idea where shops were located.
Evaluation of methods:
In my first hypothesis I collected a lot of data and I have organized this onto a map to show clusters of medium order goods.
The only problem I encountered when looking at the types of shops was putting them into groups and also if the shop covered more than one category, e.g. a small sweet shop that also cut keys.
The way I collected the data from the shops was to walk to the end of the road and walk back again this time recording the shops I saw. The advantage of doing this was that it was very systematic and I didn’t miss any out, the only disadvantage of this was that some shops were longer than others, so it was difficult to write down exactly were each shop was.
To make this better I would give a wider range of numbers to classify shops and also have a map with the shops on and then classify them to make it more reliable.
In my second hypothesis, I collected a lot of data, as each time I stood on Burscough Street I counted an average of 95 people passing by. I stood for a total of one hour, there were 15 minute sessions in which we collected this data, we did this a total of 4 times.
The only problem I encountered was whether to count certain people, e.g. babies in prams or people that have walked past before.
I solved this problem by only counting adults. The advantage of this method is that I could get an extensive result from standing in that position for a total of one hour. The disadvantage was that I only collected in one place and I may have also miscounted the people walking from my left to right. This was solved by standing a group of 30 pupils around Ormskirk, so that we could get an extensive range of results. The other disadvantage was that I only collected on one day so I could not get an accurate range of results. The way to solve this would be to go every day for a week and get a full set of results.
If I repeated this data collection again tomorrow I would stand in more than one place, go for a couple of days and also make sure there are no anomalies in my results because of miscounting.
To improve the reliability of this method I would go for more than one day and get two people to stand in one place to increase the accuracy.
Hypothesis three: In my third hypothesis I only collected ten sets of results, so I did not collect enough data to get a good set of results.
This was also solved by getting the class of 30 pupils to get 10 results each and these totaled 300 results.
I had a couple of problems with this data collection because firstly I would only approach people that looked approachable, so before I had even started I had discriminated against certain people. Secondly when we did approach people some of them were in a hurry and did not stop to answer. If they did stop, they would sometimes not take the survey too seriously or be in a hurry so their answers would be incorrect because they rushed.
If I repeated this data collection tomorrow I would ask more people about the survey so I could get a more accurate results table. I would also ask people who are not I hurry and I would not avoid asking certain types of people.
To increase the reliability of the survey I would ask more people about how often they shop and I would make the questions easier to understand so there would be no misunderstanding.
Hypothesis one:
There is a tendency for shops selling medium order goods to cluster.
Classify retail outlet
Selling goods: Come out with a product/tangible.
Selling services: Services help you/doesn’t provide a product.
High order goods:
-
Expensive
- Not bought very often
- Goods that you would travel to buy them. E.g. computers, game consoles, beds/furniture.
Low order goods
These are goods that are
- Cheaper
- Bought very frequently
- You would not travel to buy them
E.g. milk, paper, shampoo, drinks food.
Medium order goods
- Goods that are purchased every 2-4 weeks
- Compare prices and quality- shop around.
- More expensive than low order goods
E.g. shoes, clothes, large shop for food, petrol.
Evaluation of classification system
Classification-
The good aspect of using this classification system is that it’s easy to use and it’s simple to look at.
The bad aspect of using this classification system is that some shops are hard to classify such as;
Hardware shops/Repair shops- repairs are services and hardware can be bought/Bicycle shop/Key cutters- as they sell items as well as bringing you a service.
We classified these results into four main categories, high order, in which we put shops that were very expensive and not regularly visited. Medium order goods, in which we put in shops that had mid range prices and also that in which people only visited once every three months. Low order goods that sell cheaper goods, and in which people visit daily or once weekly. Lastly services, which are the most useful of all the shops as shown by the amount of “Service” shops in a town.
Services offer a service to the public, so prices range, to solicitors who charge a lot to give you their service to dry cleaners who are cheaper than that of solicitors prices.
Yellow = High order Red = medium order
Blue =Low order Green = service Brown = Vacant
The bar graph showing the amount of shops in each area of goods
Analysis of graph:
We can clearly see that services have the highest number of shops, then medium order goods, then low order, then high order and vacant shops were in the minority.
This bar graph shows that most shops in Ormskirk are services and that only 9 shops were vacant.
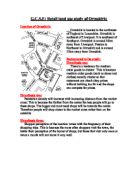
My Rn Value
My Rn value was 0.70067142, which I have rounded down to 0.70. Using the diagram and connecting the Rn point to (n). On the sheet below this indicates that there is a tendency to cluster with medium order good shops.
This distribution of medium order goods was probably due to competition, most shops will group together if they are selling the same sort of items.
Shop owners who are setting up shops would usually want to set up close to the town center as it is were all the shops meet together. This would cause clustering around the town center.
Customers will want to compare prices of similar items so if shops are clustered together, this will make it a lot more easier to do, E.g. clothes and shoe shops tend to cluster.
Using my tracing paper and my numbered map I can see that medium order goods tend to cluster in random areas of Ormskirk. Many of the shops that tend to cluster are clothes shops, shoe shops and bookshops. These are the most common shops in this area, so I can conclude that medium order goods cluster but randomly.
Nearest neighbor analysis
This will allow me to describe the distribution of medium order goods/shops.
Rn=2d √ n/a 72.7
Rn = 2 1.4254901
= 2 x 1.43 √51/840 1.43 2.d.p
0.70
Evaluation of hypothesis one:
Looking back at my data I can see that my data has been reliable enough to make accurate predictions and those predictions were correct.
My collection and classification system is good, but to improve it I could classify the shops in terms of goods so a pet shop could be classed as medium order.
When I was plotting the data the map was moving about so it was often hard to keep track of where everything was.
My tracing paper shows resemblance to my nearest neighbor analysis, however my nearest neighbor is far more accurate.