Scientific explanation
When the ball is lifted up to the height that I am going to drop it from, it has gravitational potentional energy, then when the ball is released the ball has kinetic energy, so if I doubled the height, I think that the gravitational potentional energy (GPE) will also double, so the kinetic energy would also double. When the metal ball hits the sand the force will move it, this is called work, the work is moving the sand against the friction that the sand provides to give the crater, so therefore there will be double the work done, so the crater in sand would double its diameter.
Graphs
Preliminary work
In the preliminary work that I carried out I took a tub of sand, a boss and clamp, a meter ruler, and three metal balls which consisted of the diameters 6mm, 12mm and 16mm.I then set the apparatus up. With each ball I dropped it twice from a low release point and a high release point, these points were 50cm and 100cm. this was to see which of the balls had the biggest difference, and this would determine which of the balls I used in the final experiment. I chose to do the preliminary experiment twice. The results are as follows:
These results show that the ball with the biggest difference was ball two with a difference of 1.0 both times I did the experiment. So this is why I chose to do the main experiment with ball 2.
Range
The range of heights that I used were the highest being 100cm to the lowest being 10cm I chose these heights because there were practical I could drop the ball without causing much hazard, I made 100cm my highest height because if I did a higher height I wouldn’t be able to reach the height, it would also be very hard to get it on target to hit the sand. I made sure that the heights were evenly spread out so I went up in 10's. The release height in cms went 10, 20,30,40,50, 60, 70, 80, 90,100cm. I will repeat the experiment three times, then I have collected all the results I will work out the averages.
Diagram of experiment
List of apparatus
- A metal ball
- Sand
- A tub
- 1 meter ruler
- Boss
- A clamp
- A paper clip
- 30cm ruler
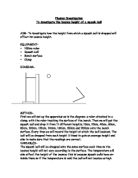
Method
- First of all I will set up the apparatus, like in the diagram above. I will put the boss and clamp together, then fill the tub with sand so that it is full to the top and is very flat and then attach the meter ruler so that it lies just on top of the tub of sand.
- I will then get the ball that I have chosen to do the main experiment with and I will hold it at a height and then I will drop it.
- To measure the crater that the ball has left in the sand I unraveled a paper clip and stretched it to the widest part of the crater, and then I will hold it against the smaller ruler and measure off the ruler.
- I will do this three times at each height.
- When I have got all the results, I will add the three results that I got for the one height, and then I will divide them by three.
Safety precautions
The safety precautions that I will take will be not to throw the sand in case it goes in any ones eyes, I will be careful not to let the balls roll on the floor so that no one will stand on then and cause any on to fall on then.
Results
Analysis
I found out that the more I increase the chosen factor, most of the out come variables increase as well, so the higher I drop the metal ball the more force he ball comes down with and the bigger the impact cater is. In my graph I have a curved line of best fit this is because near the end of the experiment the results don’t really go much higher.
Release height=20cm impact crater=2.7cm
X2
Release height=40cm impact crater=3.7cm
This shows that when I doubled the release height the out come variable increased but it didn’t double, so this show that my quantitative prediction wasn’t right but the prediction was right in a way because the impact crater did in crease as the release height increased.
40/20= 2
X2
3.7/2.7=1.4
Scientific conclusion
The conclusion shows that when I doubled the GPE it didn’t double the work done, but I found out that the GPE does have an effect on the work done. When the GPE was increased so was the work done, this is because the extra energy create more work so the sand moves more. It may not have doubled because some of the energy may have been lost in working against friction or air resistance. The sand may also so have something to do with the impact crater not doubling because when the ball hits the sand the force of the ball causes the sand to compact and it doesn’t move as much.
Evaluation
I took the readings fairly accurately but this could have been made more accurate by measuring the craters to the exact mm because on some of the reading I took the reading to the nearest cm. I don’t think that I could really have made it more accurate.
Anomalous points
I have marked the two anomalous points on my graph; the anomalous results were at 70cm and 100cm release height. I think these anomalous results were caused because the sand may not have been as evenly spread out as it could have been or there could have been a lump of wet sand that it landed on, there are a lot of explanations why these points could be annulus. I have anomalous points both above and below the line of best fit there fore I could have let the ball go from too high or too low when the ball was being released.
Improve the experiment
I could have improved the experiment by making sure all the sand was even and not in clumps, I could have got a wider tub with not as much depth because this may have caused a bad result because when I dropped the ball from a long distance I sometimes missed because the tub I used was very deep which made the sand hard and compact and it was also not very wide.
Reliability
I could have changed the experiment to obtain a bigger range of results by making the range of results smaller, I could of made the intervals between measurements it could have gone 5, 10, 15, so this could also make smaller intervals between the readings. I could have repeated the experiment a few more times and then I would have had a more accurate average for each of the release heights. The points lie quite well on the graph
Further work
The further work that I could have would probably be to drop the ball from higher heights to see what the affect would be I could have tried dropping the ball into different solids. Taking more results would also see if the graph would level off. To have tested the balls from different heights I would have needed to get a longer ruler, the graph seems to show that you reach a point where the crater will stop increasing.