An investigation into the relationship between height and weight at Mayfield High school
2002-04-18 An investigation into the relationship between height and weight at Mayfield High school Objectives: a) To investigate the relationship between height and weight across the whole of Mayfield school. b) To investigate the relationship between height and weight for boys and girls across the whole of Mayfield school. c) To investigate the relationship between height and weight with age (each year group), for boys and girls. Expectations: For a) I expect that the investigation of height and weight across the whole of Mayfield School will show a general pattern, this pattern being that as a child's height increases so does their weight. However, I also expect that for any given height that I will find a wide variation in weight. For b) I expect that an investigation into the height and weight of boys and girls will be as follows. Boys who get taller will also become heavier. Also I think the girls will follow this general pattern. But of course there will be a few that don't fit this pattern (anomalous data is expected). For c) I expect that height and weight will have a similar relationship for year seven pupils meaning that the heights and weights will be the same. But in years eight and nine the girls will be generally taller and heavier than boys showing us a higher growth rate (change over time) at this stage. But again in year ten and eleven the boys
Maths Coursework Introduction
Introduction Aim: In this experiment, I will be investigating the relation between peoples estimating ability compared to their Midyis score. I am investigating this because I want to see if a person's Midyis score is high, will there estimating ability be higher than others who have a lower Midyis score. I will carry out this investigation by comparing the accuracy of estimating year 8 students. Method: I will be collecting data from a total population of 56 year 8 students. I have chosen to collect data from 56 pupils because it is not too large or to small and it can give me an accurate result to what I am investigating. By using a total population of 56 people I will be able to clearly see the differences and similarities between pupils Midyis scores and their estimating ability. Each pupil will be given 2 strips of paper which will have a line measured 15 cm long where they can draw there estimation. On the first paper they will estimate how far down the line is 8 cm and on the second paper they will estimate how far 14 cm is. Their estimation will be recorded and the difference towards their estimation and the real measurement will be recorded. Their Midyis score and gender will also be recorded to see the comparisons between each and if they effect the overall estimation. Pilot Survey: Before I collect my data I will complete a pilot survey. This pilot survey
Is there a link between IQ and Key Stage 2 results?
GCSE Statistics Coursework Is there a link between IQ and Key Stage 2 results? Introduction: IQ 'has no impact' on exam success Psychologists say memory is the key to good GCSE results. I intend to investigate whether there are links between your Intelligence Quotient and your Key Stage 2 results. I intend to do this by looking at data from 12 to 16 year olds who attend Mayfield High school. Lines of Enquiry: My lines of Enquiry shall include: Links between IQ and KS2 results Links between gender and IQ Links between gender and KS2 results Links between age and KS2 results Hypothesis: I predict that Gender will have little effect on both IQ and KS2 results; this is because although females are more mature than boys at adolescence, both IQ and test results depend on the individual. I also predict that IQ will have a strong effect on KS2 results because someone with a higher IQ is able to learn and remember things better so consequently their KS2 results shall be higher than those with a lower IQ. I also predict that someone's KS2 results may be related to what year they took their KS2 exams as learning techniques may be improving as more research is being done in this area. For this reason I would predict that the older you are, the lower your KS2 results shall be. Data Collection: To investigate these links, I tested my questionnaire on a few people first to see
To find the relationship between certain factors of children from Yr 7-11. These factors include height, weight, gender and age.
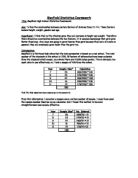
Mayfield Statistics Coursework Title: Mayfield High School Statistics Coursework Aim: To find the relationship between certain factors of children from Yr 7-11. These factors include height, weight, gender and age. Hypothesis: I think that as the children grow they will increase in height and weight. Therefore there should be a correlation between the two factors. It is common knowledge that girls grow faster than boys. Also, boys are going to grow heavier than girls because they eat a lot more in general; they will eventually grow taller than the girls too. Introduction: Mayfield is a fictitious high school but the data presented is based on a real school. The total number of the students in the school is 1200. 18 factors of information have been collected from the students which means, on a whole there are 21600 datum points. This is obviously too much data to use effectively so I took a sample of 100 from the school. Year Sample Size* Calculation 7 25 300/1200 * 100 8 23 270/1200 * 100 9 22 260/1200 * 100 0 6 200/1200 * 100 1 4 70/1200 * 100 00 *N.B. The final values have been rounded up to the nearest 10. From this information I collected a sample every certain number of people. I could have used the random number function on my calculator, but I found this method to be more straightforward and equally effective. Year Sample Size* No.
Data Handling Project - Mayfield High School
Data Handling Project Mayfield High School is a school for students ages 11 to 16. it is a growing school so the number of students in each year varies. I am going to be finding a relationship between the Date of Birth vs. IQ. The Data was provided for me whom means it was secondary data. The data was provided in a think booklet which consists of several columns containing both Quantative and Qualitative Information. The Data In the Columns were... The Year Group of the pupil The Name, Surname and the 1^st and 2^nd Forename Age In months and years Month Of Birth The Gender Hair Colour Favourite Colour Average Number of hours of TV Watched per a week Stats Results Eye Colour Favourite Band And many more....... From this data I will make a theory and I will try and prove it by creating graphs and diagrams. The hypothesis of this Question that I want to use the data from the Mayfield High School to prove that pupils born in March have a higher Intelligence Quotient (IQ) than people not born in March. I will begin by taking a random sample of 30 Pupils born in March and 30 Pupils not born in March from the booklet and record there Date of Birth and IQ number. I will get these random people by doing a stratified sample. To get my data and graphs I am going to sort and filter data from the key Stage 4 information. I am going to sort firstly by Birth
In this experiment I will investigate whether a rubber ball when dropped from descending heights affects the height at which it bounces up to.
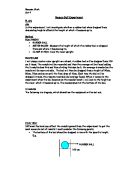
Bouncy Ball Experiment PLAN Aim In this experiment I will investigate whether a rubber ball when dropped from descending heights affects the height at which it bounces up to. Method EQUIPMENT * RUBBER BALL * METER RULER- Measure the height of which the rubber ball is dropped from and where it bounces up to. * CLAMP STAND- Hold the ruler upright. PROCEDURE I will clamp a meter ruler upright on a stand. A rubber ball will be dropped from 100 cm 3 times. The results will be recorded and then the average will be found adding the 3 results does this and then dividing this sum by 3, the average is needed so the results will be more reliable. The ball will then be dropped from a height of 90cm, 80cm, 70cm and so on until the final drop of 10cm. Each time the ball will be dropped 3 times, the results recorded and average found. When it comes to the experiment when the ball bounces on the wooden bench I will look to the height on the ruler, which it bounces up to, The measurement at the bottom of the ball. DIAGRAM The following is a diagram, which shows how the equipment will be set out. FAIR TEST Different factors may affect the results gained from the experiment to get the most accurate set of results I must consider the following points, * The bottom of the ball should be dropped in line with the specific height. E.g. * When the ball bounces back up the height

Statistic Coursework
GCSE Statistics Year 10 Coursework Rebecca Millhouse 3/19/2009 Aims, Design and Strategy The aim of this investigation is to discover if there is a link between two variables and see whether they are dependant or independent on each other. In order to carry this out with reliable results I will need to collect suitable data which I can use statistical methods to calculate and analyse correlation coefficients and regression lines, taking into account any anomalies that may affect the correlation coefficients and regression. In this investigation I am going to be looking into whether more females prefer creative subjects to males, and then in turn whether males prefer logical subjects. I believe that female students will prefer the creative subjects such as Art and Music as when they were younger they may have spent more time practising these with family and friends. I also believe that females are better at creative subjects then males, and if a student is good at a subject they enjoy it more. I feel that this data should provide me with a strong link. I will also investigate whether there is a link between the amount of television watched and gender. If my first hypothesis is proven correct then I will go on to test whether males watch more telvison than females. I believe that if they have chosen more logical subjects than they will also watch more television having
Paper Helicopters
GCSE Physics Coursework Paper Helicopters In this investigation I will be exploring an aspect of paper helicopters. The factors that affect the fall are: * Position of weight * Height of drop * Weight of weight * Wing length These all could be researched in the same way. For example exploring the position of weight would be carried out by dropping the same helicopter off the same height several times with the weight in various positions. Changing just one variable. I would go about the height of drop experiment in the same way but changing the height of the drop instead of the position of the weight. The weight of the weight would be done with one variable being changed once again; the mass of the weight would be changed between drops and recorded accordingly. Wing length is the variable I am most interested to look into because I feel that it is the most interesting. The experiment would be carried out in the same way with different wing spans being dropped from the same height. The apparatus wouldn't vary much from experiment to experiment: a small values balance would be needed for the mass of weight experiment. A stopwatch for all the experiment would be needed. A height or heights at which to drop them from would be needed, a ruler to measure the wing length if necessary and a scissors to make all the helicopters to start with. The factor which I have chosen to
The report investigated the weight, height, arm span and shoe size of 20 males and females included their records, discussion whether they are overweight or underw
CONTENTS . Abstract 2. Introduction 3. Method 4. Results 5. Discussion 6. Conclusion 7. Reference . Abstract: The report investigated the weight, height, arm span and shoe size of 20 males and females included their records, discussion whether they are overweight or underweight, and final conclusion about the result. The final result after discussion is gender does have affect on height, weight, arm span and shoe size. 2. Introduction: The science report investigate the body mass (height, weight, arm span and shoe size) to understand relationship between weight, height and arm span. Body mass data of 20 people of both genders in the same age range from 19 to 23 will be used in the report. I predict some of the people will be overweight, underweight and balance; arm span will be approximately equal to height and height is relating to weight. My hypothese is gender will have affected on body mass of height, weight, arm span and shoe size. 3. Method: The data of 20 males and females within age range of 19 to 23 will be collect. The data will be presents in a table, which include note and BMI. Graphs will be sketch base on the data table. BMI will be used to determine the balance of body. BMI=Weight (Kilograms) Height2 (Metres) 4. Results: Number Height (m) Weight (kg) Arm span (m) Shoe size (UK) Gender BMI (3 sig.) Note .69
In this project I will investigate the correlation between various sets of information from a database of pupils from Mayfield High School. I will try to spot correlation between two different sets of information.
In this project I will investigate the correlation between various sets of information from a database of pupils from Mayfield High School. I will try to spot correlation between two different sets of information. In this project I will investigate the correlation between various sets of information from a database of pupils from Mayfield High School. I will try to spot correlation between two different sets of information. Home : Maths : In this project I will investigate the correlation between various sets of information from a database of pupils from Mayfield High School. I will try to spot correlation between two different sets of information. : In this project I will investigate the correlation between various sets of information from a database of pupils from Mayfield High School. I will try to spot correlation between two different sets of information. Introduction In this project I will investigate the correlation between various sets of information from a database of pupils from Mayfield High School. I will try to spot correlation between two different sets of information. I will pick only sets of information that I predict to show good correlation, and therefor tell me something about the data. Example, I will be able to say that girls are more intelligent that boys or vice versa if the correlation shows that to be. Hypothesis In this investigation I am going