Modelling procedures
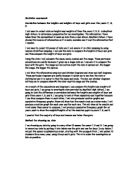
The above scatter graph clearly shows that the data is normal and that there is a linear relationship between the two data items as all the observation points can be contained within an ellipse.
Analysis:
As the two variables are uncontrolled, both are random and independent, I am going to use the Product Moment Correlation Coefficient (Pmcc,rm) to test for the correlation.
The measures found are shown below, with calculations shown in appendix 3:
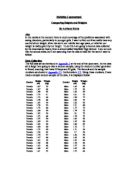
Mean x = 1.676
Mean y = 55.56
Sx2 = 0.009
Sy2 = 60.646
Sxy = 0.299
rm = 0.404
Using the value of rm I will now carry out a hypothesis test:
Ho: p=0 There is no correlation
Ha: p>0 There is a positive correlation between Height and Weight
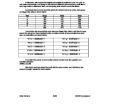
Using a 5% significance level the critical value for this sample of 50 is: 0.2353
0.404 > 0.2353 therefore we reject Ho; there is a positive correlation between height and weight.
Interpretation
I have found out that from my test that the height is given by the weight and that these two do relate to each other. Therefore it is safe to assume that we do not have control over are height.
The test I have just carried out shows that there is a correlation between height and weight. However the test that was carried out was for both males and females. Therefore I shall now see if there is a correlation between the height and weight of the gender separately.
Modelling Procedure – Males
The above scatter graph clearly shows that the data is normal and that there is a linear relationship between the two data items as all the observation points can be contained within an ellipse.
Analysis – Males
As the two variables are uncontrolled, both are random and independent, I am going to use the Product Moment Correlation Coefficient (Pmcc,rm) to test for the correlation.
The measures found are shown below, with calculations shown in appendix 4:
Mean x = 1.694
Mean y = 58.68
Sx2 = 0.011
Sy 2= 63.738
Sxy = 0.3.64
rm = 0.425
Using the value of rm I will now carry out a hypothesis test:
Ho: p=0 There is no correlation
Ha: p>0 There is a positive correlation between Height and Weight
Using a 5% significance level the critical value for 25 teenage boys is: 0.3365
0.425<0.3365 therefore we reject Ho; there is a positive correlation between height and weight.
Modelling Procedure – Females
Looking at the graph it looks like the results for the females does not fit a straight line. Therefore it looks like there is no linear relationship between the two data items. As all the observation points can not be contained within an ellipse.
Analysis – Females
As the two variables are uncontrolled, both are random and independent, I am going to use the Product Moment Correlation Coefficient (Pmcc,rm) to test for the correlation.
The measures found are shown below, with calculations shown in appendix 4:
Mean x = 1.658
Mean y = 52.44
Sx2 = 0.006
Sy 2= 38.086
Sxy = 0.122
rm = 0.256
Using the value of rm I will now carry out a hypothesis test:
Ho: p=0 There is no correlation
Ha: p>0 There is a positive correlation between Height and Weight
Using a 5% significance level the critical value for 25 teenage girls is: 0.3365
0.256<0.3365 therefore we accept Ho; there is no correlation between height and weight
Interpretation for males and females
Form both the tests that I have carried out, for the teenage boys we accept Ho. This is because there is clear evidence that there is a positive correlation between height and weight. Therefore it is safe to assume that as a teenage boy gets taller his weight also increases, therefore teenage boys do not have control over their weight.
However for the girls this was a different case, due to that we reject Ho. This is because there is no correlation. Therefore I must conclude that form theses results it looks like the weight of a teenage girl is not given by the height (the taller the girl does not necessary mean that the girl is heavier than a girl who is not that tall). Therefore it is my conclusion that girls are more obsessive over how they look and are influenced by models.
Accuracy and refinements
The accuracy of these results is fairly accurate this is because I randomly selected my results. However there is a possibility that most of the overweight people were selected, as well as taller people being selected.
I can improve the quality of the work by doing a stratified sample, the strata’s being different weights and heights, e.g. strata’s being <40 kg, 40-50 kg, 50-60 kg and 60+ kg. So I equally chose equal number of people from each weight category.