To calculate the number of year 7 boys in my sample I need to do this calculation: 151/604 x 40 = 10.
I will calculate the others in a similar way for both girls and boys.
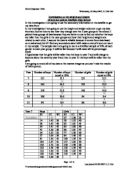
I need to choose 10 boys at random year 7. To do this I have number sorted my data base in to male and female. And then by year group. I numbered each of the boys in year 7 from 1to 151. I did the similar thing for all other years.
For me to get a random number between 1 and 151 I use the Ran# key on my calculator.
e.g. .: 151 Ran# = 18.573
=19
So I chose the 19th boy and wrote down his height. (165cm)
I carried out the same for 9 more boys in year 7. If I got the same random number twice or more, though it is unlikely I would then ignore it and chose another one.
I then did the same for the boys and girls through to year 11. The table shows the length of 40 boys and girls I have sampled.
Now I have my data I will check to see if there are any unreasonable values. The tallest boy is 194cm this is very tall but also possible. The smallest boy is 136cm this is also quite small but still possible. The tallest girl is 178cm this is also possible and so reasonable. The smallest girl is 135cm this may seem small but is reasonable.
Now I will group the above data which I will use to structure two histograms.
Boys
Girls
Now I will create two histograms using the tables above and compare my findings.
It is possible to comprehend from the graphs that most boys were found to range predominantly between 165cm and 175cm. I also establish that very few boys were between the heights of 185cm and 200cm. In comparison with the girls the boys were generally taller than the girls. The most common height for the girls was between 155cm and 165. I found that whilst there were few boys that were ranging from 185cm to 200cm there were no girls that did at all between those ranges.
Now I shall compare the heights of boys and girls by drawing cumulative frequency curves, this shows how the cumulative frequency changes as the data values increase. I must work out the upper and lower quartiles so that I can then draw two box and whiskers diagrams.
I have now drawn both Cumulative frequency curves on the same graph to make comparison easier and noted down the median and quartiles and from that I have drawn two whisker and box diagrams.
From the two whiskers and box diagrams I have been able to make these comments:
- 50% of boys are taller than the upper quartile for girls
- the shortest boys and girls are the same height
- boys on average are 7cm taller that girls
- 25% of girls are taller than the average boy
- 50% of boys are taller than the median for girls
- 75% of girls are shorter than the average boy
I can also see that when using the histograms and the whiskers and box diagrams, that there are more short girls than short boys and more tall boys than tall girls.