1.55
1.56
1.70
1.65 =43.53
1.59
1.59
My final step is to divide the total by the number of figures.
43.53/28 = 1.5546
The mean number of year 7 girls’ heights is 1.55m to the nearest cm.
MEDIAN: My first step to finding the median is to set out the data in numerical order.
1.20 1.59
1.36 1.59
1.45 1.59
1.45 1.60
1.46 1.60
1.48 1.61
1.48 1.61
1.52 1.62
1.54 1.63
1.54 1.63
1.55 1.64
1.56 1.65
1.56 1.70
1.57 1.75
I now must work out the half way point between the numbers. I know there are twenty-eight numbers in the sample and so therefore the half way point between the numbers is fourteen and a half. As this is not a whole number I will have to use the mid point between fourteen and fifteen.
Fourteenth number = 1.57
Fifteenth number = 1.59
Mid point number = 1.58
The median for year 7 girls’ heights is 1.58m.
MODE: To work out the mode I need to work out how many of each height there are in this sub set. To do this I will set out the data with the number of that height next to it in brackets.
1.20 (1) 1.59 (3)
1.36 (1) 1.60 (2)
1.45 (2) 1.61 (2)
1.46 (1) 1.62 (1)
1.48 (2) 1.63 (2)
1.52 (1) 1.64 (1)
1.54 (2) 1.65 (1)
1.55 (1) 1.70 (1)
1.56 (2) 1.75 (1)
1.57 (1)
From the presentation of this data I can see that the mode is 1.59 as it is the height with the most people from the sample.
The mode for year 7 girls’ heights is 1.59m.
A box plot diagram and histogram will help show the ranges and present data.
Standard deviation is a good measure of spread as it tells how far away each value in the data is away from the mean.
The standard deviation of year 7 girls’ heights is 0.020 to four significant figures.
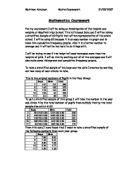
SUB SET – year 7 boys
I have chosen the following data for my analysis. I have selected my data using stratified sample. Previously I decided to use a sample of 60 pupils per year. I used a stratified sample to get a proportional number of pupils within the year group. The equation I used for the girls gave me the information I needed to be able to tell that I needed to pick twenty-eight out of the sixty pupils. This leaves me with thirty-two pupils once I have subtracted the twenty-eight away from the sixty.
MEAN: I have already completed my first step by collecting all the data. My second step is to add together all the relevant values.
1.62 1.64
1.45 1.53
1.52 1.63
1.36 1.54
1.47 1.30
1.58 1.61
1.60 1.50
1.60 1.45
1.55 1.63
1.71 1.55
1.42 1.74
1.65 1.65
1.50 1.52
1.62 1.57
1.51 1.56
- 1.41
=49.60
My second step to finding the mean is to divide the total of the heights by the number of heights.
49.60/32 = 1.55
The mean number of year 7 boys’ heights is 1.55m to the nearest cm.
MEDIAN: My first step to finding the median is to set out the data in numerical order.
1.30 1.56
1.36 1.57
1.41 1.58
1.42 1.60
1.45 1.60
1.45 1.61
1.47 1.61
1.50 1.62
1.50 1.62
1.51 1.63
1.52 1.63
1.52 1.64
1.53 1.65
1.54 1.65
1.55 1.71
- 1.74
I now must work out the half way point between the numbers. I know there are thirty-two numbers in the sample and so therefore the half way point between the numbers is sixteen and a half. As this is not a whole number I will have to use the mid point between sixteen and seventeen.
Sixteenth number = 1.55
Seventeenth number = 1.56
Mid point number = 1.555
This rounds up to 1.56m
The median for year 7 boys’ heights is 1.56m.
MODE: To work out the mode I need to work out how many of each height there are in this sub set. To do this I will set out the data with the number of that height next to it in brackets.
From the presentation of this data I can see that there is more than one mode they are 1.45m, 1.50m, 1.52m, 1.55m, 1.60m, 1.61m, 1.62m, 1.63m and 1.65m as they are the heights with the most people from the sample.
The modal values for year 7 boys’ heights are 1.45m, 1.50m, 1.52m, 1.55m, 1.60m, 1.61m, 1.62m, 1.63m and 1.65m.
A box plot diagram and histogram will help show the ranges and present data.
Standard deviation is a good measure of spread as it tells how far away each value in the data is away from the mean.
The standard deviation of year 7 boys’ heights is 0.017 to four significant figures.
Analysing Boys and Girls Heights in Year 7
From the data shown above I can see that, on average, boys and girls are very similar heights although girls have a slightly taller average height. We can also see that girls have a larger range of heights than boys through the box plot diagrams and the standard deviation results. In my hypothesis I thought that girls would be taller than boys in year 7, therefore my hypothesis correct, although I did believe that the difference between girls heights and boys heights would be much greater.
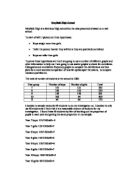
SUB SET – year 11 girls
I have chosen the following data for my analysis. I have selected my data using stratified sample. Below is the equation I used for my stratified sample.
Number of people in sub
set sample.
Number of people in sample
Number of
people in set.
No of people
in sub set.
Although 30.35 isn’t a whole number if I round it to 30 it is good enough for the stratified sample I have conducted.
I am now going to work out the mean for my analysis.
MEAN: I have already completed my first step by collecting all the data. My second step is to add together all the relevant values.
1.67 1.62
1.62 1.65
1.63 1.60
1.72 1.63
1.73 1.80
1.63 1.52
1.69 1.68
1.62 1.69
1.65 1.62
1.65 1.55
1.61 1.63
1.52 1.61
1.68 1.59
1.63 1.62
1.72 1.58
= 49.16
My final step is to divide the total by the number of figures.
49.16/30 =1.6387
The mean number of year 11 girls’ heights is 1.64m to the nearest cm.
MEDIAN: My first step to finding the median is to set out the data in numerical order.
1.52 1.63
1.52 1.63
1.55 1.63
1.58 1.65
1.59 1.65
1.60 1.65
1.61 1.67
1.61 1.68
1.62 1.68
1.62 1.69
1.62 1.69
1.62 1.72
1.62 1.72
1.63 1.73
1.63 1.80
I now must work out the half way point between the numbers. I know there are thirty numbers in the sample and so therefore the half way point between the numbers is fifteen and a half. As this is not a whole number I will have to use the mid point between fifteen and sixteen.
Fifteenth number = 1.63
Sixteenth number = 1.63
Mid point number = 1.63
The median for year 11 girls’ heights is 1.63m.
MODE: To work out the mode I need to work out how many of each height there are in this sub set. To do this I will set out the data with the number of that height next to it in brackets.
From the presentation of this data I can see that the modal values are 1.62m and 1.63m as those are the heights with the most people from the sample.
The modal values for year 11 girls’ heights are 1.62m and 1.63m.
A box plot diagram and histogram will help show the ranges and present data.
Standard deviation is a good measure of spread as it tells how far away each value in the data is away from the mean.
The standard deviation of year 11 girls’ heights is 0.010 to four significant figures.
SUB SET – year 11 boys
I have chosen the following data for my analysis. I have selected my data using stratified sample. Previously I decided to use a sample of 60 pupils per year. I used a stratified sample to get a proportional number of pupils within the year group. The equation I used for the girls gave me the information I needed to be able to tell that I needed to pick thirty out of the sixty pupils. This leaves me with thirty pupils once I have subtracted the thirty away from the sixty.
MEAN: I have already completed my first step by collecting all the data. My second step is to add together all the relevant values.
1.71 1.85
1.72 1.62
1.77 1.96
1.86 1.82
1.75 1.94
1.72 1.67
1.62 1.86
1.67 1.68
1.55 1.68
1.78 1.62
1.69 1.68
1.68 1.70
1.62 1.67
1.80 1.92
1.58 1.52
=51.71
My second step to finding the mean is to divide the total of the heights by the number of heights.
51.71/30 = 1.72367
The mean number of year 11 boys’ heights is 1.72m to the nearest cm.
MEDIAN: My first step to finding the median is to set out the data in numerical order.
1.52 1.70
1.55 1.71
1.58 1.72
1.62 1.72
1.62 1.75
1.62 1.77
1.62 1.78
1.67 1.80
1.67 1.82
1.67 1.85
1.68 1.86
1.68 1.86
1.68 1.92
1.68 1.94
- 1.96
I now must work out the half way point between the numbers. I know there are thirty numbers in the sample and so therefore the half way point between the numbers is fifteen and a half. As this is not a whole number I will have to use the mid point between fifteen and sixteen.
Fifteenth number = 1.69
Sixteenth number = 1.70
Mid point number = 1.695
This rounds up to 1.70m
The median for year 11 boys’ heights is 1.56m.
MODE: To work out the mode I need to work out how many of each height there are in this sub set. To do this I will set out the data with the number of that height next to it in brackets.
From the presentation of this data I can see that the modal values are 1.62m and 1.68m as they are the heights with the most people from the sample.
The modal values for year 11 boys’ heights are 1.62m and 1.68m.
A box plot diagram and histogram will help show the ranges and present data.
Standard deviation is a good measure of spread as it tells how far away each value in the data is away from the mean.
The standard deviation of year 11 boys’ heights is 0.020 to four significant figures.
Analysing Boys and Girls Heights in Year 11
From the data shown above I can see that boys are taller than girls in year 11. We can also see that boys have a larger range of heights than girls through the box plot diagrams and the standard deviation results. The reason for this is that boys generally grow more than girls and so there will be more fluctuation in boys’ heights than girls’ height leading to the greater range. In my hypothesis I thought that boys would be taller than girls in year 11, therefore my hypothesis is correct at this stage.
Conclusion
Overall I got my hypothesis correct. I predicted that girls would be taller than boys in year 7 and boys to be taller than girls in year 11. My results reflected this prediction well. Generally all my averages worked out well although some better than others. My measures of spread proved helpful when analysing the data.
Andrew Greaves 10S