.
Hypothesis Two:-
I will use random sampling to choose the words in the article.
Quota Sampling:
I also used quota sampling for ‘hypothesis two’; I decided to choose 5% of the words of the population. However at first I chose to do 10% but when I saw that it was too large I halved it.
I also used quota sampling:
Daily Mirror:
10% of 826 words = 82.6 = 83 / 2 = 41.5 = 42
Daily Mail:
10% of 770 words = 77/2 = 38.5 (I decided to round this down) to 38.
Random Sampling: -
I used random sampling for ‘hypothesis two’ to randomly choose words from an article and measure the length of the word. I used random sampling because it is free from personal bias, and each word has an equal chance of being chosen. However the sample may still be unrepresentative of the population of words in the article.
I will now count the length of words and put them in a table.
Daily Mirror Word Length:-
The Daily Mirror has a large number of words with 6 letters in length but no words with 10 or more letters in length.
Daily Mail Word Length:-
The Daily Mail has a larger range of words with large letter count, also its words with letter length of 7 has higher frequency than the Daily Mirror.
Using the information in the table I will now need to work out the following:
- Lower Quartile
- Median
- Upper Quartile
- Outliers
This will need to be done for the box and whisker plot I am going to draw.
The formulas I will need to use:
- Lower Quartile = n + 1 / 4 = Lower Quartile
- Median = n + 1 / 2 = Median
- Upper Quartile = n + 1 / 4 x 3 = Upper Quartile
- Interquartile Range = Upper Quartile − Lower Quartile = Interquartile Range
-
Outliers = Interquartile Range × 1.5 = n, Then use n to take away from Lower quartile and also add it to the Upper quartile. Any Values which lie in past this is an outlier.
I will start working out the upper and lower quartiles for the Daily Mirror.
Lower Quartile = 42 [Total amount of Numbers (n)] + 1 / 4 = 10.75th number.
The Daily Mirror Word Lengths:
The 10.75th number lies in this category so this means that the lower quartile is four for the Daily Mirror.
Median = 42 [Total amount of Numbers (n)] + 1 / 2 = 21.5th number.
The 21.5th number lies in this category so this means that the median is six for the Daily Mirror.
Upper Quartile = 42 [Total amount of Numbers (n)] + 1 / 4 = 9.75 x 3 = 32.25th number.
The 29.25th number lies in this category because it is bigger than 29 which put it in the category above, so this means that the upper quartile is seven for the Daily Mirror.
Interquartile range = 7 − 4 = 3
I will now use the interquartile range to search for outliers.
Outliers = 3 [Interquartile range] × 1.5 = 4.5 [n]
4 [Lower Quartile] − 4.5 [n] = −0.5
7 [Upper Quartile] + 4.5 [n] = 11.5
There are no outliers because there are no values which are outside this range.
I will now do the same for the Daily Mail:
Lower Quartile = 38 [Total amount of Numbers (n)] + 1 / 4 = 9.75th number. (I will round this up to 10.)
The 9.75th (10th) number lies in this category so this means that the lower quartile is three for the Daily Mirror.
Median = 38 [Total amount of Numbers (n)] + 1 / 2 = 18.5th number. (I will round this up to 19.)
The 18.5th (19th) number lies in this category so this means that the median is five for the Daily Mirror.
Upper Quartile = 38 [Total amount of Numbers (n)] + 1 / 4 = 9.75 x 3 = 29.25th number.
The 29.25th number lies in this category, so this means that the upper quartile is seven for the Daily Mirror.
The box and whisker plots have no outliers; however the daily mail has a larger inter quartile range. The daily mail box and whisker plot is neutrally skewed, while the daily mirror box and whisker plot is negatively skewed, implying that most the values are at a higher range. However I will need to do a normal distribution diagram because it is more accurate. This is because there are no outliers to affect the normal distribution diagram.
Interquartile Range = 7 − 3 = 4
Outliers = 4 [Interquartile range] × 1.5 = 6 [n]
3 [Lower Quartile] − 6 [n] = −3
7 [Upper Quartile] + 6 [n] = 13
There are no outliers because there are no values which are outside this range.
I will now need to work out the mean and standard deviation using the values in the table which has the frequency for the word lengths.
I used my graphics calculator to calculate the mean and standard deviation for the Daily Mail and Mirror word lengths. However here is how I would do it by hand.
Formulas:
-
Mean = ∑fx / ∑f
- Standard Deviation = √ ∑fx² / ∑f − Mean²
- or, √∑f(x – mean)²/ f
Daily Mirror:
- Mean = 5.74
- Standard Deviation = 2.12
Daily Mail
- Mean = 5.34
- Standard Deviation = 2.31
I will now need to use the mean as the peak for my normal distribution diagram and the standard deviation to show were 95% of the data lies. To do this I must multiply the standard deviation by 2 and not ‘3’ because if I multiply it by 3 I will get negative numbers. I will then use the value I obtained by multiplying the standard deviation by 2 and I will ± it from the median.
Daily Mirror:
Mean =5.74
Standard Deviation = 2.12
2.12 x 2 = 4.24
6 − 4.24 = 1.7
6 + 4.24 = 10.24
Daily Mail:
Mean = 5.34
Standard Deviation = 2.31
2.31 x 2 = 4.62
5 − 4.62 = 0.38
5 + 4.62 = 9.62
The Daily Mail clearly has a larger spread from the mean implying that the Daily Mail uses words with a larger range of length.
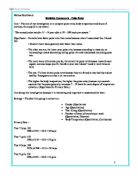
Hypothesis Three: -
“The Daily Mail will have small headlines and a multitude of text.”
I believe the Daily Mail will have small headlines and a multitude of text. On the other hand, the Daily Mirror will have large headlines and small area of text. I am lead to believe this because the Daily Mirror is aimed at people who are busy and do not have the time to read a large amount of text. Furthermore the large headlines are needed to attract the busy customer’s attention. The small brief of text is designed to give people the general gist of the story, while the Daily Mail is designed to give readers detailed information on the story. I am going to get a sample of thirty articles, which will be stratified by category. I will make sure these articles are in proportion. I will then measure the area of the headline and text, after this I plan to plot the data on a scatter graph. I will then work out the mean to plot the line of best fit which will allow me to interpolate and extrapolate. I will then need to work out the spearmans rank correlation of the headline and text. This will tell me the relationship between the headline and text.
Hypothesis Three
I will now rank the area of headline and text accordingly for Spearmans Rank:-
I am going to use stratified sampling to choose the article of which I will measure the area of headline and text.
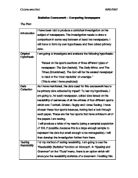
Stratified Sampling: -
I used stratified sampling to choose the articles that I was going to measure the area of. This was in ‘hypothesis three’, I stratified the articles by genre and made sure each sample was in proportion to the total amount of articles there was of that genre. I used stratified sampling because it would be representative of all the types of articles. Because some articles area may differ because of the type of article it is. For example if the newspaper is specialised in entertainment articles, the entertainment articles would be bigger. However I did not include adverts within the sample because I do not consider them as articles.
Daily Mail = 280 – 138(adverts) = 142
Daily Mirror = 326 – 152(adverts) = 174
Here is an example of how I put the articles in proportion:
38[no. of articles in that genre in the newspaper]/142[total no. of articles] = X [variable] / 30 [Sample Size]
Or, 38 x 30 / 142 = X
Or, 1142 / 142 = X
Or, 8.028 = 8 = X
Daily Mirror:
Sport = 8
Crime = 4
Politics = 2
Celebrities = 5
Health = 1
Entertainment = 5
Social = 1
Finance = 1
Opinion = 2
Art = 1
Daily Mail
Sport = 6
Crime = 2
Politics = 5
Celebrities = 1
Health = 1
Entertainment = 6
Social = 4
Finance = 4
Opinions = 1
I also will use quota sampling to choose my sampling size.
Quota Sampling: -
I used quota sampling because I was asked by my teacher to choose a sample of at least 30 articles for hypothesis three. However I used stratified sampling to put the different genre of articles into proportion.
And I will actually use convenience sampling to choose the articles I am going to measure the area of headline and text for.
Convenience Sampling: -
I used convenience sampling when choosing the articles for which I would measure the area of headline and text out of the array of articles I had, however I did this because it was convenient and was not time consuming.
Daily Mirror Spearmans Rank: -
1 – 6 X 721.5 ÷ 30(30²-1)
Or, 1 - 4329 /26970
Or, 1 - 0.160511679 = 0.83948832
Spearmans Rank = 0.83948832
This means there is a strong Positive relation between the area of headline and text. This means that if the area of headline is large then the area of text is large this works vice – versa. So this means that the Daily Mirror consistently has large headlines and large amount of text.
Daily Mail Spearmans Rank: -
1 - 6X1954/30(30² - 1),
Or, 11724/26970,
Or, 0.434705228031146 = 0.565294771968854
Spearmans Rank = 0.565294771968854
The Daily Mail has weak positive relation between the area of headline and text, this is because <0.5 there is no relation. Also the Daily Mail has large headlines and relatively large text but this is not CONSISTENT. In comparison to the Daily Mirror which has a strong positive relation, the Daily Mail is a sensational newspaper which may have a large headline and relatively small text, or large amount of text and a small headline. There is no consistent pattern.
My hypothesis was actually wrong, and it seems the actual result is a complete opposite because there would need to be a negative relation for my hypothesis to be true. However I must further continue to fully verify my hypothesis’s fault.
I will need to make a scatter graph so I can interpolate a value for both newspapers and compare the values.
I will now use the area of headline and text to make a scatter graph.
Gradient for Daily Mirror = 55 / 40 = 1.375
Gradient for Daily Mail = 67 / 40 = 1.675
The gradient for the Daily Mail is 1.675 meaning that for every increase in 1cm² for the area of headline the increase for the area of text is 1.675cm². In comparison the gradient for the Daily Mirror is 1.375 which means for every increase of 1cm² for the headline there is an increase of 1.375cm² for the text. This tells me that when the headline increases there is a larger increase for the area of text for the Daily Mail however there is a stronger relation between the area of headline and text for the Daily Mirror because the increase of the text is only 0.375cm² larger then the increase of the headline. This is further backed up by the spearmans rank coefficient.
Equation of the line for Daily Mirror =
Y – 126.87/X – 77.23 = 1.375
Or, Y – 126.87 = 1.375 (X – 77.23)
Or, Y – 126.87 = 1.375X – 106.19125
Or, Y = 1.375X – 106.19125 + 126.87
Y = 1.375X + 20.67875
This means that to get a value for the Y(area of text) axis I must do 1.375(gradient) × area of headline(X) + 20.67875. (Y intercepts).
Equation of the line for Daily Mail =
Y – 168.99/X – 74.34 = 1.675
Or, Y – 168.99 = 1.675 (X – 74.34)
Or, Y – 168.99 = 1.675X – 124.5195
Or, Y = 1.675X – 124.5195 + 168.99
Y = 1.675X + 44.4705
This means that to get a value for the Y (area of text) axis I must do 1.675(gradient) × area of headline(X) + 44.4705(Y intercept).
I will now need to interpolate a value using the equation of the line so I can compare the two values.
Daily Mirror interpolated value for a 100cm² headline:
Y = 1.375 × 100 + 20.67875 = 158.17875cm²
Daily Mail interpolated value for a 100cm² headline:
Y = 1.675 × 100 + 44.4705 = 211.9705 cm²
The Daily Mail in comparison to the Daily Mirror has a larger area of text for a headline with the same area. This implies that the stories are more detailed than in the Daily Mirror.
Hypothesis Four: -
Talk about newspaper appealing to the different sexes.
Use a questionnaire to ask women and men which they read.
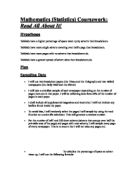
Sampling: -
Systematic Sampling: -
I did not use systematic sampling because there was no need to use it. I could have used it in place of random sampling for choosing the words however it was much simpler to use the graphics calculator for random sampling.
Cluster Sampling: -
I did not use cluster sampling because there was no use for it. I could have used it to estimate the total number of articles however that would not be accurate and I would not know the different type of articles there were.
Opinion Polls: -
I did not use any opinion polls because it was too time consuming and it was not necessary for the investigation. Also the sample size would have to be large.
Conclusion of Hypothesis One: -
The Daily Mail has 152 adverts out of a total of 326 articles, 46.6258% of the articles in the Daily Mail are adverts, and on the other hand the Daily Mirror has 138 adverts out of a total of 280 articles, 49.28571% of the Daily Mirror articles are adverts. The Daily Mail has a larger number of adverts and also a larger number of articles; however the Daily Mirror has a larger proportion of adverts in its newspaper. The Daily Mirror in turn also focuses more on celebrity gossip, entertainment, and crime. While the Daily Mail concentrates on politics, finance and social/lifestyle events. From the composite bar graph it is evident the daily mail has a larger proportion of entertainment article, while the Daily Mirror has a larger number of sports articles. From the comparative pie chart I know that the Daily Mirror has a slightly larger proportion of adverts than the Daily Mail.
Conclusion of Hypothesis Two: -
Neither box and whisker plots have outliers; however the daily mail has a larger inter quartile range. The daily mail box and whisker plot is neutrally skewed, while the daily mirror box and whisker plot is negatively skewed, implying that most the values are at a higher range.
The normal distribution diagram for the daily mail has a much larger spread from the mean, meaning the Daily Mail has larger range of words. However from the normal distribution diagram it is evident that the Daily Mirror generally uses longer words.
Conclusion of Hypothesis Three: -
The Spearmans rank correlation for Daily Mail was 0.58 (2 d.p) which means there was a slight positive correlation between the headline and text. Which means that if the area of headline is large then the text may be relatively large but this is not always the case because it is only a slight positive relation? On the other hand, the daily mirror has a strong positive relation between the headline and text. The Spearmans rank for Daily Mirror is 0.84 (2 d.p), which means if the headlines are large the text is also going to be large as well. To add, the Y intercept for the Daily Mirror was 20.67875cm² which mean the minimum for the area of text is 20.67875cm² if someone was to interpolate a value of zero for the header area, however this would mean there would be no story so the Y intercept is unrealistic. On the other hand for the Daily Mail the Y intercept is 44.4705cm², which means if you were to interpolate a value of zero the area of text would be 44.4705cm². This is also unrealistic because without a header there is no story. Furthermore both graphs have a positive correlation, meaning there are a large number of low values. The gradient for the Daily Mail is 1.675 meaning that for every increase in 1cm² for the area of headline the increase for the area of text is 1.675cm². In comparison the gradient for the Daily Mirror is 1.375 which means for every increase of 1cm² for the headline there is an increase of 1.375cm² for the text. This tells me that when the headline increases there is a larger increase for the area of text for the Daily Mail however there is a stronger relation between the area of headline and text for the Daily Mirror because the increase of the text is only 0.375cm² larger then the increase of the headline. This is further backed up by the spearmans rank coefficient.
Final Conclusion
The conclusion I have drawn from this investigation is that the Daily Mirror has a greater proportion of adverts because it does not sell as much as the Daily Mail so it needs a greater proportion of adverts to gain more revenue. While the Daily Mirror has longer words but this may be due to the fact that the article I analysed was within the crime genre which the Daily Mirror specialises in. The Daily Mirror is more of tabloid than the Daily Mail; the Daily Mail is catered more for the businessman and people with higher grade of education. However it seems I was incorrect about my prediction for the Daily Mail, I said that Daily Mail will have small headlines and a multitude of text. But this does not seem to be the case; the Daily Mail seems to be a sensational newspaper which may have a large headline and relatively small text, or large amount of text and a small headline. There is no consistent pattern. On the other hand the Daily Mirror has a strong Positive relation between the area of headline and text. This means that if the area of headline is large then the area of text is large this works vice – versa. So this means that the Daily Mirror consistently has large headlines and large amount of text.
Limitations
There were many things to add, optimise and improve about my investigation if I were to conduct it again. Firstly, the source for my information was not totally reliable due to the fact that I only chose one sample from one particular day. To gain a more accurate sample I would need to choose sample from a different day and week. I would then be able to compare the samples to gain an average between the two to give me a more accurate view of the investigation. I couldn’t do this because of lack of time and because I am doing it by myself. Furthermore I didn’t include the adverts when I was gathering samples for my area of headline and text; however I do not think the adverts are relevant because the content of the advert was made by third party members and not directly influenced by the newspaper however the editor of the newspaper still has some control over it. Also my secondary data was slightly out of date; however I doubt this had much impact on my work because the Daily Mail average circulation is 39.5% higher than the Daily Mirror. This implies that it already has a strong user base and it is unlikely people would change newspapers because people tend to stay with what they trust.