Year 11 Boys and Girls heights
I am choosing a sample size of 40 to gain an accurate result. I am using systematic sampling because it’s easy to do and is suitable for large samples.
Year 11 Girls = Total of Girls/Sample size = 86/40 = 2.15
Therefore every 2nd pupil I will choose as a sample.
Year 11 Boys = Total of boys/Sample size = 84/40 = 2.1
Therefore every 2nd pupil I will choose as a sample.
After I went through the whole sheets choosing every 2nd value, I went to the start, moved down 1 and began choosing again every 2nd value.
Year 11 Girls
40
Year 11 Boys
40
Comments
Range: The girls had a wider range from 100cm – 180cm. The boys had a narrower range of 150cm – 210cm.
Taller Pupils: The taller pupils were the boys, the highest being 200cm≤x<210cm. The tallest height for the girls was 170cm≤x<180cm.
Modal class: The modal class for the girls was shorter than the boys’ modal class. The bulk of the boys lie to the right meaning they are taller.
Expectation – This is what I expected that the boys would be taller that the girls in year 11.
Both
Range: In year 7 the boys had a wider range and the girls had a smaller range the opposite to year 11.
Taller Pupils: In year 11 they had significantly much higher heights than in Year 7.
Modal Class: In year 11 the modal classes are higher than in year 7 but the boys seem to be the tallest in both years and lie further to the right.
Expectation: I predicted that the boys would be taller that the girls in year 11. Although I wasn’t entirely correct, I expected the girls would be taller in year 7 and shorter in year 11 but it turned out to be that the girls were generally shorter that the boys in both years.
IQ Results
I am taking IQ results from year 7 – 11 boys and girls and comparing the results. I am using a stratified sample so that the boys and girls have the same proportion. Then I’m using systematic sampling because it is the easiest and is suitable for large samples. Total Sample Size = 100 to get a wide range of results.
Boys Year 7 –11
How many boys for Year 7: how many boys in year 7/total of boys*sample size = 151/604*100 = 25 (number of stratified sample)
Year 8: how many in Year 8: how many boys in year 8/total of boys*sample size = 145/604*100 = 24
Year 9: 118/604*100 = 20
Year 10: 106/604*100 = 18
Year 11: 84/604*100 = 14
Systematic Sampling
Year 7: boys in year 7/how many needed = 151/25 = 6.04 Therefore choose every 6th pupil.
Year 8: 145/24 = 6.04 Therefore choose every 6th pupil.
Year 9: 118/20 = 5.9 Therefore choose every 6th pupil.
Year 10: 106/18 = 5.88 Therefore choose every 6th pupil.
Year 11: 84/14 = 6 Therefore choose every 6th pupil.
Girls Year 7 – 11
Year 7: 131/579*100 = 23 (number in stratified sample)
Year 8: 125/579*100 = 22
Year 9: 143/579*100 = 24
Year 10: 94/579*100 = 16
Year 11: 86/579*100 = 15
Systematic sampling
Year 7: 131/23 = 5.69 Therefore choose every 6th pupil.
Year 8: 125/22 =5.68 Therefore choose every 6th pupil.
Year 9: 143/24 = 5.95 Therefore choose every 6th pupil.
Year 10: 94/16 = 5.87 Therefore choose every 6th pupil.
Year 11: 86/15 = 5.73 Therefore choose every 6th pupil.
Grouped Frequency Tables
I have put my results in a grouped frequency distribution table to condense the amount of information I have taken.
Boys Year 7 –11
Girls Year 7 – 11
When I was systematically sampling when I reached the end of the sheet I started again but 1 lower than last time until I reached the desired amount.
IQ Results from Year 7 to 11
Boys and Girls
BOYS
Lower Quartile = 95
Median = 101
Upper Quartile = 108
Inter-Quartile range = UQ-LQ = 108-95 = 13
The 10th percentile (Bottom 10%) = 90
The 90th percentile (Top 10%) = 114
Girls
Lower Quartile = 97
Median = 102
Upper Quartile = 106
Inter-Quartile range = 106-97 = 9
The 10th percentile (bottom 10%) = 92
The 90th percentile (top 10%) = 113
Comments:
The girls had a higher Lower Quartile meaning the girls lower results weren’t as low as the boys. The girls had a higher average that the boys but the boys had higher top results.
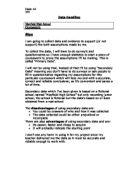
Box Plot:
I have chosen to show my results in a box plot because it is easy to understand and you only need a quick glance to understand it. This is because if it lies to the right it has higher results and it also shows you the minimum value, Lower Quartile, median, Upper Quartile and maximum value all in just one simple diagram.
Comments:
The range for the boys = 81 – 140 and the girls = 80 – 130. Therefore the boys had a wider range than the girls.
The boys had the highest IQ result that was a mark of 131 – 140. On the box plot the boys upper 50% lied further to the right meaning they have higher IQ results.
Also the boys bottom 50% of the data ranged from 80 – 108. The girls bottom 50% ranged from 80 – 106.
Overall the girls had the higher IQ marks because they had a higher lower quartile than the boys and higher average. But I must stress that the marks were very close and the boys had a higher upper quartile meaning the boys top results were higher than the top results for the girls.
This is exactly what I expected to a certain degree that the girls had a higher IQ than the boys but I expected that the difference in IQ scores between boys and girls would be greater, these results show they are very close.
Year 11 Boys and Girls
Height and Weight Results
I will be comparing the height and weight of Year 11 boys and girls. I will be choosing a systematic sample of 40 boys and 40 girls because it would save time than just choosing everyone; it is also a big enough sample to get accurate results.
Year 11 Boys: total of year 11 boys/sample size = 84/40 = 2.1 Therefore every 2nd result I will choose to put in to my sample.
Year 11 Girls: total of year 11 girls/sample size = 86/40 = 2.15
Therefore every 2nd result I will choose to put in to my sample.
Here is the sample of weights and heights which I took:
Girls
Weight (Kg) Height (Cm)
52 167
36 155
44 163
54 168
50 173
50 156
48 163
51 172
42 165
54 161
38 152
56 175
60 175
48 168
54 158
30 137
45 103
48 157
50 155
48 169
39 162
48 174
45 160
63 160
45 156
38 152
60 163
52 170
54 165
47 162
38 168
55 156
50 178
44 155
42 152
42 169
55 171
50 160
60 183
Boys
Height (cm) Weight (Kg)
171 57
172 63
177 57
186 56
175 60
172 58
162 52
167 50
155 54
178 67
169 50
168 50
179 72
180 72
173 60
182 66
175 68
181 54
165 58
170 50
174 65
169 80
186 63
168 56
168 92
162 58
168 56
170 70
167 45
182 38
152 48
162 60
167 62
176 84
206 59
163 38
151 45
152 72
170 54
184 76
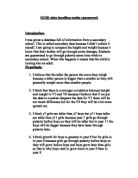
I will represent my results in the form of a scatter graph, so I can comment on the correlation.
Scatter Graph
Year 11 Girls:
These had a moderately strong positive correlation, with a few outliers. The points seemed to be rather close; they were all squashed together in a small patch.
Year 11 Boys:
These had a mildly strong positive correlation. It had many outliers. The points in this graph are spread out more resulting in a mild positive correlation.
Good or Bad Correlation?
I plan to measure 10 points on the graph, which are the furthest away from the line of best fit. The further the points the worse the correlation it has, the closer the points the better the correlation the point has.
I will circle the chosen points, measure the distance from the point to the line remembering to keep the ruler perpendicular to the line (90°).
Here are the distances, which I recorded in ascending order:
Boys: 1.6cm Good Correlation
1.7cm
1.7cm
2.5cm
3.1cm
3.3cm
4.6cm
5cm
5.1cm
5.9cm Bad Correlation
Average for boys = Total distances/10 = 34.5/10 = 3.45cm
Girls: 1.3cm Good Correlation
1.5cm
1.6cm
1.7cm
1.9cm
1.9cm
2.2cm
2.6cm
7.7cm Bad Correlation
Average for Girls = Total distance/10 = 24/10 = 2.4cm
Therefore the girls had the best correlation, the average difference being 1.05cm less than the boys. The lower the distance is the better the correlation.
Comments
Girls:
The girls seemed to have their bulk of their height in the 150 – 180 cm zone. The girls weight was concentrated in the 40 – 60 Kg area. There were a few outliers, one was really short but heavy and another was tall and very heavy.
Boys:
The boys seemed to have their bulk of the heights in the 150 – 190 cm area. The boys weight was concentrated in the 45 – 75 kg region. There were many outliers, 2 were very heavy but had a medium height and 2 others were very tall but light considering their height.
Comparisons
- The boys seemed to be taller than the girls.
- The girls were lighter than the boys.
- The boys had many outliers but the girls only had a couple.
- In both cases it is true to say that in general as the height increased so did the weight besides a few anomaly results.
- Overall the boys were taller and weighed more than the girls.
Expectation – This supports my prediction, the boys were taller and weighed more than the girls and in general as someone’s weight increased so did their height.
Conclusion
I now conclude that the results, which I obtained for the different heights of boys and girls in year7 and 11, tell us that in year 7 the boys were taller than the girls. This is not what I expected because I thought that the girls would be taller than the boys. In year 11 the boys were again taller than the girls, this supported my prediction that the boys would have higher heights than the girls in year 11. But I wasn’t totally correct because I predicted that in year 7 the girls would be taller and in year 11 the boys would be taller, so therefore my prediction was half correct. The boys had a wider range in year 7 and the girls had a wider range in year 11.
The results for year 7 – 11 boys and girls IQ scores were very similar. The girls had a slightly higher average but the boys had a higher upper quartile. The girls marks ranged from 80 – 130 whilst the boys ranged from 80 – 140. Therefore the boys had a wider range. The boys upper 50% lies further towards the right meaning that they had higher marks. Also the girls had a higher Lower Quartile meaning the girls lower results weren’t as low as the boys. The boys and girls results were almost identical but overall the girls had the highest IQ’s. This is what I expected but I thought the difference between the IQ results of the boys and girls would be larger.
The height and weight results for the year 11 boys and girls showed us the following:
- The boys had higher weights.
- The boys were taller
- The girls had a strong positive correlation whereas the boys had a weak positive correlation.
- The boys had many outliers whilst the girls had a few outliers.
- The girls had most of their heights in the 150 – 180cm mark and their weights in the 40 – 60 kg region.
- The boys had their bulk of heights in the 150 – 190cm region and their weights in the 45 – 75 kg area.
- Also in both graphs it showed us that the taller a person was the higher the persons weight would be.
These results supported my prediction because the boys and higher weights and bigger heights that the girls and the shorter a person was, the lower the persons weight.
Evaluation
I am quite pleased with my overall of results but I would have liked to improve my results by:
- Having bigger samples wou7ld make my results even more accurate.
- I could of chosen more than one school to get better results because the more different types of people you have the more accurate your results will be.
- Maybe I could have changed the variables. For example: Eye colour, Hair colour and a persons favourite television program.