I will raise the board up slowly; making sure it is rising at an even pace. I will use trigonometry to calculate the angle at which the block falls.
I will use the formula Sin-1 = O÷H.
E.g.
I will use trigonometry to calculate the angle because it is more accurate than using a protractor. I will tip each block three times and then average out my results. This will reduce the chance of a large mistake or anomaly in my results. I will make sure the board and bench are flat by placing a level on their surfaces.
I will use a wooden block to raise the board. I will place the block underneath the board and slowly push it towards the end of the board so that the board is slowly raised.
I also tried to use a pulley system to raise the board.
I found that it was difficult to measure the angle and stop the board from moving out of position and that the block was a far more accurate way of obtaining the results.
I discovered that small blocks slipped down the board before they tipped over. I tried some sandpaper on the board to create more friction but it still slipped. I then tried an elastic band on the board in front of the block and this stopped it from falling.
I also found out that the block I used to raise the board needed to be in front of the elastic band otherwise it caught and would affect the result.
The elastic band might have changed the angle at which the blocks fell but it changed the result for all of them so they remained in proportion to each other.
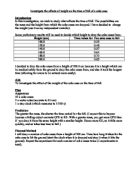
Results
These are the results for the experiment. I tried each height three times and averaged out my results. The angle is measured in degrees and the height is measured in centimeters.
Analyzing Evidence
The evidence shows that the tallest block fell at the acutest angle and the shortest block fell at the largest angle.
The graph I have drawn (on graph paper) has a negative correlation. It shows how as the height is increased, the angle at which the block falls is decreased. My line of best fit is a smooth curve and links all the blocks together (there were no anomalies).
On the graph I have drawn up to my curved line from the height 4cm and from 8cm. I tried to discover if the height of the block was directly proportional to the angle at which the block tipped. Here are my results:-
4cm = 46.5º
8cm = 28.5º
If they had of been directly proportional to one another then I would have expected the angle to halve if the height was doubled. I doubled the height, but the angle did not halve. This means that the angle and the height are not directly proportional to one another or my results are wrong.
I then tried it again with heights of 3cm and 6cm.
3cm= 54.5º
6cm= 34.5º
These results also show that the angle has not halved when the height is doubled. Again, this could be due to error in my results. I conclude that further work here is needed if an accurate conclusion can be drawn.
t also shows how the
n drawndlock
This might be useful in further investigation work because it means that you can draw up from any height, take a reading of the angle, then test a block with the same height and compare the angle the block falls to the reading you have taken from the graph. I would expect these results to be extremely close to each other if my previous results are accurate.
I conclude that the tallest block will fall at the acutest angle. I am led to conclude this because of the results that I have collected and the scientific theory of center of mass. The results show that as the block height increases, the angle at which the block falls, decreases. The scientific theory behind centre of mass is consistent with my results and graphs.
Evaluating
The procedure used is described in the plan. I did not change the procedure from my plan because it was the most effective and accurate way of obtaining the evidence in a school laboratory.
I thought that the quality of my evidence was good. The results for each attempt were fairly close to each other and the average balanced them out. My graph curve was smooth and there were no anomalies in the results.
The procedure was not completely reliable because:-
- The elastic band stopped the block from tipping. This might have been improved if rubber had of been used instead of the elastic band.
- We don’t know if the blocks were completely regular. Further testing is required to make sure that they were regular and that their centre of mass was in the centre.
- Their was bound to be human error in measuring the angle and making sure the board didn’t move, but this could have been reduced by using computers to measure the angle and raise the board, but the equipment was not available so the block was the most accurate way in a school lab.
I think that the evidence I collected is reliable enough to support my conclusion. I think this because the graph I produced proves the scientific theory behind centre of mass. It proves that the higher the centre of mass of an object, the acuter the angle that it will fall. For this experiment to be completely reliable we would have to use equipment that the school lab does not have.
Further work I might be able to do might include:
- Measuring the mass of the block and measuring the density using the formula Density = Mass x Volume. I do not think this would affect the angle the block falls at because the centre of mass will be in the same place, regardless of its mass or density.
- Doing the experiment with a wider range of block heights. This should make the graph more accurate because the more data there is, the more accurate the line of best fit becomes.
- Trying different block widths to try and prove that the block tips when its centre of mass is outside its base. Use a large range of widths, keeping the height the same.
- Try the experiment more than three times and average out the results. The more times the experiment is tried, the more accurate it becomes.
- Change the center of mass. Move it up to the top or to the bottom, keeping the height the same. This should make a considerable difference to the result.
- Try more heights on the graph to try and find out if the angle and height are directly proportional. Try a wider range. E.g. 12cm and 24cm.