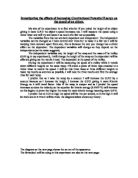
I predict that at 0.25 m high the speed will be 1m per second, at 0.5m high it will be 2m/s and at 0.75m it will be 3m/s. the diagram below shows my theory:
The diagram on the next page shows the set out of the apparatus:
The formulas I will be using in this experiment are also on the next page:
To prove my theory I looked up Gravitation on Microsoft Encarta to see if their theories where similar or the same as mine and if there was any information to help the experiment go smoother. The definition was:
‘Gravitation, the force of attraction between all objects that tend to pull them toward one another’
I then found information on acceleration that said: ‘An object that is released and allowed to fall towards the ground is accelerated uniformly.’ Neither mentioned the speed of an object and no information was found on speed from this source.
Method:
I set the apparatus as shown on my diagram:
- We placed a ramp on a wooden block at a height of 0.33m.
- Prepare the ticker tape in to 9 strips of 2m lengths.
- Place trolley supported ready to role down the slope.
- We then stuck a piece of ticker tape an inch on to the trolley and left another inch gap from the edge of the tape and the ticker-timer.
- We set up the electrical circuit so the ticker-time would be able to work.
- We switched on the ticker-time and released the trolley down the ramp letting it run until it reached the end of the 2m tape.
- We detached the tape and repeated twice more.
- We raised the ramp up to 0.43m and repeated steps 1-5 again.
- We raised the ramp up to 0.53m and repeated steps 1-5 again.
- This would produce an average speed so our results were more accurate.
I then collected my results into a table and worked out the equations from my diagram sheet:
Analysis.
As I increased the G.P.E I was trying to show the effect of it on the speed, to give the object more G.P.E I raised the ramp giving it more height.
We attached the ticker timer paper to the trolley and we decided that because we had measured the ticker timer tape to 2m and attached it to the same place, we found the easiest way to control the distance was to let the ticker timer tape run out. We did this three times for each height and recorded the data. We got very close results for each height as shown in my table and the distance only varied between 1.90 and 1.98m. To find the time we counted on the paper, each 5 dots represented 1/10th of a seconds, from that we were then able to calculate the speed by dividing the distance (length) by the time taken. I then added the 3 times up and divide by three to calculate the average speed, I think we had quite an accrete average speed because the three speeds were all similar.
If you look at the table you will notice for each height the speed becomes higher, so does the G.P.E and K.E because if you place higher numbers (the speed/height) into a space in an equation the answer will become larger. So the higher the ramp the greater the G.P.E, K.E and speed. This is because it follows the laws of science.
My data supports my predictions because as I predicted as I increased the height the speed also increased. I didn’t predict the correct amount though; I thought if you raised the height by h you would increase the speed by x.
At …
0.25m the average was 1.18 (21.2%)
0.50m the average was 1.36 (36.8%) 15.6% and 10.7% rise.
0.75m the average was 1.58 (47.5%)
So the information from my data doesn’t give enough support or accuracy to prove the increase % because you would need to do it over a longer spread of data. I also predicted that the G.P.E and K.E would increase this is true because if you take the equation for P.E which = mass x gravity x height the mass and gravity are constant and don’t change at any height but as you increase height it gives a larger product from the equation. As you raise the height you give it more G.P.E as you give the object longer or a greater distance to fall so it’s able to increase the speed.
Evaluation.
From my results and ticker timer tape I constructed a graph, I randomly chose one piece for each graph. The graphs are shown on the following pages.
I think our method was simple but effective and produced quite accurate results, I have displayed my results in a table and checked for any incorrect data or any that stood out. I found no data that caused concern it was all very close to one another and gave results I was pleased with showing a trend. We kept the same set up of apparatus and plank surface so it was a fair test so I think it made the results more reliable.
One improvement I’d make if I was to redo the experiment would be to measure exactly 2m and place a stopper at the end of the 2m so the trolley stops and each records the same amounts of dots, extra work I could do towards this is to try different length planks example of 1m and 2m and find the average of the two to see if the speed increases in the top or bottom half. I’d do more heights so I’d be able to estimate the percentage of speed increase and it would give me more data to prove my point hopefully it would improve accuracy.
You also have to consider friction from the board, if it had a totally smooth surface the trolley will move faster, but if it us bumpy as loss of energy through friction slowing the trolley.
I think I have produced strong enough results and evidences to provide a conclusion be not enough accuracy to show my results are the definite results everyone are expected to get. I show a strong of trend of results to prove speed does increase with height giving more G.P.E, you would need to do the experiment many time with more heights. Taking more care and accuracy adjusting the experiment by my improvements.
In conclusion I believe if you increase the height the speed of the trolley, the G.P.E, and the K/E will also increase