Apparatus
In this experiment we will need to use:
- Desk
- 100cm ruler x 2
- 100g weights
Method
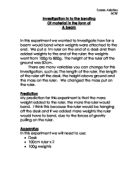
Firstly, we will place the ruler 70cm off the desk; because of the height of the desk the height above ground would be 82cm. Then continuously add 100g to the end of the ruler and measure the height above ground after each one. We then put these results in to a table.
Table
We then put all these results in to a graph and drew the line of best fit.
Fair Test
To make this experiment a fair test, we have to:
- Keep the ruler at the same length after each weight has been placed on.
- Keep the ruler at the same height so it does not change the bendiness of the ruler.
- Add 1 weight at a time
- Always measure the bend of the ruler at a certain time after the ruler has stopped bouncing, so you do not get a wrong measurement.
Analysing results
A sensible range fir each axis is: For the ‘x’ axis is 8cm + and for the ‘y’ axis again, 8N +.
In the graph you can see that the points have a very similar pattern and seem to be going in a straight positive line. This is proved, as the best-fit line does go through nearly all the recorded results. For the amount of bending, you can see that the bendiness of the ruler in cm is very much like the force on the ruler in Newton’s. eg. When The Force on the ruler is 3, the amount of bending is 3.05, which is very close to 3. This happens in all of the results shown in the graph.
I think we got these results because it is proportional that the more weights added the more the ruler would bend and eventually snap. This can also mean that1 weight can be ≈ to 1cm off bending.
These results do match my prediction because the more force added to an object the more the object will have to bend/move etc.
Evaluation
I think the experiment went well, because our results were all accurate and in a graph all went together well in the line of best fit. The graph does show a very good line of best fit. Most off the results in the graph are not anomalous, however the results are not exact and a few are a little bit under or over the line of best fit. The results are quite accurate, but you would not be able to tell the difference of decimal points.
We could improve this investigation by choosing a different variable, which would have been a little harder to work out answers.