Sample Method considered
I had considered initially using the stratified sample because it offered the largest spread of data concerning different types of people. However I couldn’t use this sample as the data was collected by my teacher; hence I was unable to split the pupils into categories. I could have divided them into groups depending on their height, arms pan and head height however I felt that this was slightly biased because I was influencing the data by putting it into groups.
Data collection
I have received the data for the height, the arm span and the head height of the members from both the fifth form and the first form. These three sections of my data are useful because I can then compare them with the other measurement commenting on similarities and differences. There are 163 pupils in the first form and 185 in the fifth form, however this is too much and therefore needs to be sampled down. The data has already been collected from my teachers therefore it is called secondary data
Problems with the data
Even though I have decided on which method to use for sampling by data there can be some problems with the data.
The height measurements, are provided by the pupils of an age group between 11 and 16, where there would be a slight tendency to exaggerate their height by a few centimetres. I have often presented myself to be taller than my actual height therefore I feel this may also be reflected in the sampled data. Also the accuracy of the data may be compromised because almost all pupils appeared to have rounded their height up to the nearest centimetre.
Another distortion to the accuracy of the data is that the 1st form boys are 11 at the beginning of the year and the 5th form boys are 15, therefore if the results were taken at the end of the year the members in the 1st form will be 12 and the pupils in the 5th form will be 16. This is significant in terms of percentage because the 11 year olds would have had a higher proportional increase in height than those compared to the 5th formers.
Some of the data may be missing and on some occasions there will be no response from the pupil at all. Therefore this data will have to be missed out because I will not know there exact measurement – otherwise I will have to guess. Instead of choosing the faulty data I will use the data from the next pupil on my list. This therefore allows us to make all the diagrams valid and they do not include incomplete data.
There is one typing error from the section about the pupil’s height. This person’s height is stated to be 1444cm, which can not be true. The correct height should be 144cm, however I can not assume this because the error could have been a missing decimal point: 144.4 therefore I will leave this data out because I am not a hundred percent sure on what the figure is supposed to be.
Another practical problem which is not as obvious as the other two is the fact that there are 37 members selected from the population in the fifth form but there is only 33 members chosen from the first form. I could cancel out 4 representatives from the fifth from to make 33 members from each year group however this will not be a fair reflection on how many people there are in the fifth form in comparison to the number of pupils selected, and hence there will be an uneven proportion. Therefore I will leave the data to be 37 chosen members from the fifth form and 33 members chosen from the first form.
At the end of my project I can go back and look at the faulty data and see what the effect of the anomalies. I can also perhaps put in results from my calculations into the missing data and see whether the outcome differs.
The accuracy of the data overall could have been enhanced with quality measures or checks where the teacher would confirm a percentage of the pupils data. Also, providing measuring tapes would have meant that the pupils would not have not just used rulers or other inadequate means of height measurements but would have been more accurate. Furthermore group controls may have ensured the quality of the sample data whereby each pupil’s height is performed in groups of two for superior accuracy.
Alternatively an independent measurement of the required data from each pupil by the teachers could have helped to ensure the accuracy of the sample data.
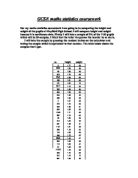
Below is the list of sampled data from which I received from doing the simple random sample on Microsoft Excel.
Validating my hypotheses
Hypotheses 1:
To find the mean of the height for the 5th and 1st formers I can produce a histogram and compare which year group is taller. I have to work out the frequency density to do this I must divide frequency by class width. Below are tables showing the class intervals and a histogram.
The histogram shows that the frequency density values for the 5th form are higher than for the 1st form, which means the mean value is likely to be higher for the 5th form. It also shows that 2, 5th form frequency density bars are over 2, while there are no bars over 2 for the 1st form, this further proves that the 5th form have a higher mean value than the 1st form and their data is more spread out hence a larger range.
To check this I will also pair up the data and find the percentage difference. I will then find the average of this difference and then see if it is or is not within 10% of the proposed hypotheses.
To find the percentage difference, I found the difference from the 2 height measurements form each year group and then divided it by the 5th formers height then multiplied it by 100.
For example for the 1st 2 measurements:
174 - 150 = 24
24 / 174 = 0.1379
0.1379 X 100 = 13.79
I was able to find the average of these differences easily on excel by copying my data onto the excel spreadsheet then, highlighting the column until the next free cell and then clicking on the average function on the tool bar.
The total percentage difference for the height of 1st and 5th formers is 13.52575.
Therefore my H was correct as the percentage difference was above 10%.
I will now look at the median value of the fifth formers and the first formers, to accomplish this I must find the middle value from my sampled data. To achieve this I will put the sampled data into order, putting the highest at the top of the list and the smallest at the bottom of the list. To attain this in excel I will highlight the data, press DATA on the tool bar and press sort – ascending. Then you identify the 20th and the 21st numbers and find the middle value of these two numbers.
For example: the 20th and 21st numbers for the height of the 1st year is 150 and 151, therefore the number in the middle of this two figures is your median value. In this case it is 150.5
The results for the median values are as follows:
1st form = 150.5
5th form = 175
Therefore my H is again true because the difference is above 15cm.
To determine the modal class value, I organised the data into a frequency table and established the most common class interval.
The two tables shown below are those of the 5th form and 1st form.
The most frequent class interval for the 1st form is 141 – 150 (cm).
The most frequent class interval for the 5th form is 171 – 180 (cm).
Therefore the H is again correct because the 5th formers most frequent class interval is bigger than the 1st formers most frequent class interval.
Hypotheses 2:
To determine whether the mean value for head height of the 5th form is closer to the median, upper and lower quartile values of the 1st form we must subtract the value by the mean and see which difference is closer to 0.
To find the lower and upper quartile value I put the data into autograph and created a graph. The box and whisker plot was made and then the results were compared. Below is a cumulative frequency diagram showing this.
To work out the median, lower qautile and upper quartile on a box and whisker diagram the below is an indication on how to do it.
Lowest Value Lower quartile Median Upper quartile Highest Value
The graph with the box and whisker plots show than the 5th forms median, upper and lower quartile values are close together for both year groups suggesting that the values will be very near to the mean. However the 1st form range is much larger than the 5th forms range therefore the 3 values should be closer to the mean for the 5th form. The graph shows that the median and lower quartile results are the same; the two values are both 20cm.
To check that this prediction is correct I can do the calculations manually and see which year group’s values are closer to the mean. The results are as follows.
1st form mean value = 21.31cm
1st form median value = 20cm
1st form lower quartile = 20cm
1st form upper quartile = 21.9cm
5th form mean value = 23.03cm
5th form median value = 23cm
5th form lower quartile = 22cm
5th form upper quartile = 24cm
1st form mean value – 1st form median value = 1.31cm
1st form mean value – 1st form lower quartile value = 1.31cm
1st form mean value – 1st form upper quartile value = 0.59 cm
5th form mean value – 5th form median value = 0.03 cm
5th form mean value – 5th form lower quartile value = 1.03 cm
5th form mean value – 5th form upper quartile value = 0.97 cm
The results show that the 5th form’s median value is closer to the mean value than the 1st form. It also shows that the 5th forms lower quartile value is closer to the mean value than the 1st form. However it also shows that the 1st form’s upper quartile value is closer to the mean than for the 5th form value. This means that my H is correct for the mean to median and lower quartile relationship but my Ho is correct for the mean to upper quartile comparison.
Hypotheses 3:
To find the range of head height and armspan in the 5th form and the 1st form we can display it on a cumulative frequency diagram. The range can be calculated by subtracting the highest value from the lowest value.
I first have to make cumulative frequency tables for both year groups for the armspan and the head height
Below is a cumulative frequency table and diagram showing the head height of the 1st and 5th form.
The box and whisker plot on the cumulative frequency diagram indicates that the 1st form armspan has a larger range. The range for the armspan for the 1st form is 120-171 cm, while for the 5th form the range is 145-193 cm. Even though there isn’t a large difference between the 2 ranges, it is apparent that the 1st form armspan has a larger range.
Below is a cumulative frequency table and diagram showing the Armspan of the 1st and 5th form.
For some measurements the values were in decimal places therefore I de-rounded them for example, for ‘21.1’ I took the value as 21. I didn’t round the number up as the value was not yet at 22 for example so I took the number as though the decimal place wasn’t there. The box and whisker plot on the cumulative frequency diagram shows that the range of head height for the 1st form is higher than the range for the 5th form. The range of head height for the 1st form is 14-25 cm, while for the 5th form the range is only 20-28 cm. this clearly means that the 1st form head height has a larger range.
Hypotheses 4:
To see if there is a 1 to 1 ratio with height to armspan I can use a scatter diagram to detect the relationship.
Below is a diagram of the 1st form relationship.
The scatter diagram shows that the armspan and the height are very similar for; this is true for the whole sample. The diagram shows that the two paired points are close together, meaning that each person’s height and armpsan are similar. However even though the ratio is very close it is not as close as possible. To note there are 2 main differentiates, one for the armspan and one for the height. One value for the armspan is distant to its correspondent height and this is also true for the other irregularity. Except from the 2 anomalies most of the data fits the proposed predicament.
Below is a scatter diagram for the 5th form relationship.
The diagram shows that all of the data for the armspan and the height ratio is almost 1. There are no isolated points which mean that each point has a corresponding point for both armspan and height. Unlike the 1st form data there are no irregularities in my results for the 5th form and the data is very close to each other.
Comparing the two graphs it is clear that the 5th form data for the height is closer to the armspan than for the 1st form data. The data for both year groups are similar but more so fore the 5th formers. This is because they have grown a large proportion of their achievable height therefore their height will not be as radical as the 1st formers.
I can further prove this by doing each calculation individually. I can pair the height and armspan and see how far it is from the ratio of 1:1. To do this I found the difference and then averaged them out and saw which is larger.
Results – 1st form = 5.135
5th form = 4.537
The results prove that the 5th form height and armspan is closer to one another than the 1st form. This means that my H is correct.
Hypotheses 5:
To determine if the head to head height ratio is 1:7, I can plot a scatter diagram and find the gradient of the line and if it is 1/7 then the H is correct. Below is a scatter diagram of the 1st form height and head height it also includes a line of best fit. As illustrated on the diagram there is a positive correlation but not very steep. The gradient is 1/7 therefore my H is correct
To check this I can divide the mean value and the median value of the head height into that of the height.
1st forms mean head height / mean height = 151.135 / 20.56cm = 7.35
1st forms median head height / median height = 151.5 / 20.5cm = 7.39
The calculations further prove that the ratio for height to head height is 1:7. The calculation results are between 6.5 and 7.5 which mean that my H is correct for the 1st form.
Again for the 5th form I can produce a scatter diagram with a line of best fit and see if the gradient is 1/7. Below is the diagram representing the head to head height ratio.
There is a negative correlation, as shown by the line of best fit. Also the gradient is not 1/7 which suggests that my Ho is correct this is supported by the following calculations shown below.
Again to check this I can divide the mean value and the median value of the head height into that of the height.
5th forms mean head height / mean height = 174.83 / 23.03cm = 7.59
5th forms median head height / median height = 175.5 / 23cm = 7.63
My results from the calculations show that for the ratio for the mean value the answer is not within the 6.5 and 7.5 bracket also for the median ratio it is outside therefore this suggests that my Ho is correct as the 5th form height and head height ratio is not between the designated bracket. I feel this might be the case because when you are young your heads tends to be large and as you increase in age the rest of your body grows faster than your head hence explaining why 5th formers ratio of 1:7 is not correct.
Hypotheses 6:
To achieve the result of this hypothesis I can use calculations to determine whether or not the armspan/head height is closer to the ratio of 1:7 than the height/head height ratio of 1:7. The calculations which I can use to establish a convincing conclusion are to compare the mean and median values and see which is closer to 7.
The results for the height/head height ratio for both year groups are as follows.
1st forms mean head height / mean height = 151.135 / 20.56cm = 7.35
1st forms median head height / median height = 151.5 / 20.5cm = 7.39
5th forms mean head height / mean height = 174.83 / 23.03cm = 7.59
5th forms median head height / median height = 175.5 / 23cm = 7.63
The results for the armspan/head height ratio for both year groups are as follows.
1st forms mean head height / mean armspan = 150.5 / 20.56cm = 7.32
1st forms median head height / median armspan = 151 / 20.5cm = 7.36
5th forms mean head height / mean armspan = 176.8 / 23.03cm = 7.67
5th forms median head height / median armspan = 179 / 23cm = 7.78
The results show that the armspan/head height ratio is closer to 7 than the height/head height ratio for the 1st form but not for the 5th form. For the 5th form the height/head height ratio is closer to 7. This is the case for both mean and median results. Therefore my H is correct for the 1st form results but my Ho is correct for my 5th form results. A possible reason why my Ho was correct on this occasion is because as you grow older your head height remains similar to that as before but your armspan increases due to exercise.
Conclusion & Evaluation
Most of my H predictions were correct therefore the investigation went as I planned. There were however some were my Ho were correct but a reason was given for a possible reason why my H was not correct. Therefore on the whole my results are convincing and as predicted and as I had hoped. The results mean that my earlier predictions on Di Vinci’s theories may be correct and the premises I made are also correct.
Overall the correlations and relationship between the 5th form and the 1st form data has effectively concluded with the results of my hypotheses. Those presented graphically provide the clearest favourable outcome of my hypotheses and the concluding results.
My hypothesis were constructed around the theories by Leonardo De Vinci on the rules of human proportion, I used these premises and tried to prove them with different statistical measures. From my validating, I showed that my H is mostly true but occasionally not so. Although there were some anomalies in the data, this left us with slight wrong results. Some of the data were freak values, this led me to leave them and carry out the next sample. Therefore results may not be as accurate.
The main area which presented a different trend to that expected was the I have proved my hypotheses using several mathematical justifications such as mean, median, lower and upper quartile ranges. However the results are only good as the quality of the data initially provided. The height measurements, are provided by the pupils of an age group between 11 and 16, where there would be a slight tendency to exaggerate their height by a few centimetres.
I have often presented myself to be taller than my actual height therefore I feel this may also be reflected in the sampled data. Also the accuracy of the data may be compromised because almost all pupils appeared to have rounded their height up to the nearest centimetre. Another distortion to the accuracy of the data is that the 1st form boys are 11 at the beginning of the year and the 5th form boys are 15, therefore if the results were taken at the end of the year the members in the 1st form will be 12 and the pupils in the 5th form will be 16. This is significant in terms of percentage because the 11 year olds would have had a higher proportional increase in height than those compared to the 5th formers.
I feel this exercise to be worth while and potentially provide useful information to the audience for issues such as ordering the right size uniforms and shoes in shops for particular age groups. However I strongly recommend that the height measurements are performed independently by teachers at school to ensure accuracy of data. This could hence mean an improvement in the investigation. Using the height, armspan and head height is limited for a clear conclusion and the use of other data such as weight and shoe size could have added benefit to the project.