Girls:
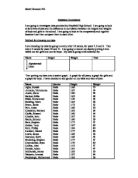
As a result of the calculations and diagrams I can compare the heights and weights of males and females.
To get a visual idea of the spread of my data, I have decided to represent it in a stem and leaf diagram:
Height
Males: 132-134-152-154-154-156-160-162-162-165-165-169-171-171-171
Females: 131-142-148-150-152-153-157-160-160-163-163-164-175-180-180
Mixed: 131-132-134-142-148-150-152-152-153-154-154-156-157-160-160-160-162-162-163-163-164-165-165-169-171-171-171-175-180-180
As you can see from the above diagram:
The shortest person from all the years is 131cm and the tallest person is 180cm.
The shortest male is 132cm and the tallest is 171cm.
The shortest female is 131cm and the tallest is 170cm.
Most of the people in the years were between 150cm and 160cm in height.
Weight
Males: 35-36-42-45-48-49-51-52-53-53-54-54-59-60-60
Females: 26-28-40-41-42-42-43-46-47-48-48-48-52-53-53
Mixed: 26-28-35-36-40-41-42-42-42-43-45-46-47-48-48-48-48-49-51-52-52-53-53-53-53-54-54-59-60-60
As you can see from the above diagram:
The lightest person from all the years is 26kg and the heaviest person is 60kg.
The lightest male is 35kg and the heaviest is 60kg.
The lightest female is 26kg and the heaviest is 52kg
Most of the people in the years were between 40kg and 50kg in weight.
From my stem and leaf diagrams it is now possible to calculate the mode, median, mean and the range.
Height
Males:
§ Mode – 171cm
§ Mean – 158.53cm
§ Median – 162cm
§ Range – 39cm
Females:
§ Mode – 160cm, 163cm, 180cm
§ Mean – 158.2cm
§ Median - 160cm
§ Range - 49cm
Mixed:
§ Mode – 160cm, 171cm
§ Mean – 158.53cm
§ Median - 160cm
§ Range - 49cm
Weight
Males:
§ Mode – 53kg, 54kg, 60kg
§ Mean – 50kg
§ Median -52 kg
§ Range - 25kg
Females:
§ Mode - 48kg
§ Mean – 43.8kg
§ Median – 46kg
§ Range - 27kg
Mixed:
§ Mode – 48kg, 53kg
§ Mean – 46.9kg
§ Median – 48kg
§ Range - 34kg
I have now decided to represent my data in box and whisker diagrams:
These diagrams are for males.
Height:
132 134 152 154 154 156 160 162 162 165 165
169 171 171 171
Smallest value = 132
Largest value = 162
Middle value = 162
132 134 152 154 154 156 160
4th value = 153 5th value 154
Lower quartile = 153 + 154 = 153.5
2
162 165 165 169 171 171 171
4th value = 167 5th value = 170
Upper quartile = 167 + 170 = 168.5
2
Positively skewed
130 135 140 145 150 155 160 165 170 175 180
LQ M UQ
Weight:
35 36 42 45 48 49 51 52 53 53 54 54
59 60 60
Smallest value = 35
Largest value = 60
Middle value = 52
35 36 42 45 48 49 51
4th value = 43.5 5th value = 46.5
Lower quartile = 43.5 + 46.5 = 45
2
53 53 54 54 59 60 60
4th value = 54 5th value = 56.5
Upper quartile = 54 + 56.5 = 55.25
2
Symmetrical
30 35 40 45 50 55 60
LQ M UQ
These diagrams are for females.
Height:
131 142 148 150 152 153 157 160 160 163 163 164
175 180 180
Smallest value = 131
Largest value = 180
Middle value = 160
131 142 148 150 152 153 157
4th value = 149 5th value = 151
Lower quartile = 149 + 151 = 150
2
160 163 163 164 175 180 180
4th value = 163.5 5th value = 169.5
Upper quartile = 163.5 + 169.5 = 166.5
2
Symmetrical
130 135 140 145 150 155 160 165 170 175 180
LQ M UQ
Weight:
26 28 40 41 42 42 43 46 47 48 48 48
52 53 53
Smallest value = 26
Largest Value = 53
Middle value = 46
26 28 40 41 42 42 43
4th value = 40.5 5th value = 41.5
Lower quartile = 40.5 + 41.5 = 41
2
47 48 48 48 52 53 53
4th value = 48 5th value = 50
Upper quartile = 48 + 50 = 49
2
Symmetrical
20 25 30 35 40 45 50 55
LQ M UQ
These box and whisker diagrams are for all years.
Height:
131 132 134 142 148 150 152 152 153 154 154 156
157 160 160 160 162 162 163 163 164 165 165 169
171 171 171 175 180 180
Smallest value = 131
Largest value = 180
Middle value = 160
131 132 134 142 148 150 152 152 153 154 154 156
- 160
6th value = 150 7th value = 152
Lower quartile = 150 + 152 = 151
2
162 162 163 163 164 165 165 169 171 171 171 175
- 180
6th Value = 165 7th Value = 165
Upper quartile = 165 + 165 = 165
2
Symmetrical
130 135 140 145 150 155 160 165 170 175 180
LQ M UQ
Weight:
26 28 35 36 40 41 42 42 42 43 45 46
47 48 48 48 48 49 51 52 52 53 53 53
53 54 54 59 60 60
Smallest value = 26
Largest value = 60
Middle value = 48
26 28 35 36 40 41 42 42 42 43 45 46
47 48
6th value = 41 7th value = 42
Lower quartile = 41 + 42 = 41.5
2
48 49 51 52 52 53 53 53 53 54 54 59
- 60
6TH value = 53 7th value = 53
Upper quartile = 53 + 53 = 53
2
Positively
20 25 30 35 40 45 50 55 60
LQ M UQ
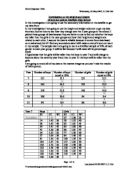
Weight
The median weight for males is 50kg compared to the median weight of 43.8kg for females. This shows that, in general, the males generally weighed more than the females. The width of the box represents the inter-quartile range, a measure of variability of the data. The diagram above conveys to me that there is more variability in the males’ data, this is because there is a wider box.
The box plot for the mixed weights is not symmetrical, the median is towards the left of the box and the whiskers are not of similar length. This shows that the distribution of values for the mixed weights is positively skewed. In comparison, the median for the males is in the centre of the box and the whiskers are an equal length. This indicates that the distribution of values for the males is symmetrical. The median for the females is towards the left-hand end of the box and the whisker to the right is considerably longer than the whisker to the left. This indicates that the distribution of values for the females is also positively skewed.
Height
The median height for males is 158.53cm, in comparison to the height of 158.2cm for the females. This shows that, in general, the males were generally taller than the females. The box for males is shorter and this shows to me that there is more variability between the females.
The box plots for the mixed heights are in the centre. This shows that the distribution of values for the mixed heights is symmetrical. The median for the males is also towards the right hand end of the box and the left is considerably long than the whisker to the left of the box. This indicates that the distribution of values for the male’s heights is positively skewed. In comparison, the median for the females is in the centre of the box, the whisker to the left is the same length as the whisker to the right of the box. This indicates that the distribution of values for the female’s heights is symmetrical.
I am now going to present my data in a several scatter diagrams:
Analysis:
I began this investigation with the aim to find the average heights and weights of males and females in years 7, 8 and 9. From this investigation I found out that the average height for a student in year 7, 8, and 9 was 158.53 cm and the average weight for a student in year 7, 8, and 9 was 46.9kg.
I also found out that the average weight for females in years 7, 8, and 9 was 43.8kg, that the lightest female was 26kg and the heaviest was 53kg, giving a range of 27kg. In terms of height, the average height for females in year 7, 8, and, 9 was 158.2cm, the tallest female was 180cm and the shortest female was 131cm, giving a range of 49cm.
For the males the average weight was 50kg, the lightest male student was 35kg and the heaviest was 60cm, giving a range of 25kg. In terms of height, the average height for a male student was 158.53cm, the shortest male student was 131cm and the tallest was 171cm tall, giving a range of 39cm.
Conclusion
On average the graph shows that the taller boys are heavier than the taller girls, and on average I would say my graphs show the boys to be heavier. My graphs show that the correlation is positive but they are both weak. Small boys are lighter in weight than small girls. Medium boys are heavier in weight than medium girls, with tall boys and tall girls. So my original prediction is correct, the majority of boys are heavier than girls.