Statistics coursework
My hypotheses are as follows: ~
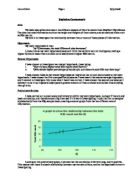
. Year 11 students are, on average, taller than year 9 students.
2. There is better correlation between height and weight in year 7 than there is in year 11.
3. The taller someone is the heavier they are.
Below are the sampling methods that I have used in my coursework:
Stratified
Simple Random
Stratified sampling can be defined as the process where the population is divided into a number of sub-groups, e.g. males aged 45-65. These subgroups are called strata, and the numbers sampled in the various strata are proportional to the size of the populations. E.g. if males aged 45-65 is known to compromise 13% of the total population in the UK, in a sample of 1000, 130 should be males aged 45-65.
On the other hand, Simple Random sampling can be defined as the process by which every possible sample of a given size is equally likely to be selected. To ensure randomness and no bias, a random number table or RAN# on a calculator is used, and the items in the sampling frame are numbered.
These two sampling methods were not used in isolation but combined to make full potential of both. For this investigation I will use a random stratified sample. This means that the data that I take the sample from is first sorted into strata and then a random sample is taken from them.
The advantage for me using this type of sampling method was that the data was already in some sort of strata e.g. year groups, gender, weight, IQ, ideal for collecting the type of data I need in answering my hypotheses. The stratified sample method doesn't really have any sort of disadvantages. This is because using this type of sampling will use all of the data and none of the data will be biased unless its numerical or alphabetic order has any relevance or affect on the results.
There are disadvantages of using a random stratified is that if the data is not in any sort of strata it cannot be used because to do this type of sampling requires strata. But this disadvantage does not affect my results since the data that I taking my sample from is already in a stratified form.
Then I have also used a random sample so therefore all of the data will be used, without there being any sort of bias. I am also using this type of sampling method on my data is because the amount of data that I have got is quite small and if a data set was large then it would mean that the random sample may not be as effective and could lead to bias.
The data that I am using is secondary data. This is because for it to be primary data it would mean I would have to collect it myself. But because I have not and I have got my data from somewhere else then therefore it is secondary data.
Total number of students: 1183
Year 11
Year 10
Year 9
Year 8
Year 7
Female
86
94
43
25
31
Male
84
06
18
45
51
Total
70
200
261
270
282
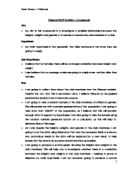
As shown above the total amount of students in the entire sample is 1183. My sample size would be 10% of the total data this is because looking at the amount of my data 10% seems to be a reasonable size. In this case 10% is 118.3, which has been rounded up to 120 for easier analysis of the data.
Below the amount of samples for each year are shown in a table: ~
My hypotheses are as follows: ~
. Year 11 students are, on average, taller than year 9 students.
2. There is better correlation between height and weight in year 7 than there is in year 11.
3. The taller someone is the heavier they are.
Below are the sampling methods that I have used in my coursework:
Stratified
Simple Random
Stratified sampling can be defined as the process where the population is divided into a number of sub-groups, e.g. males aged 45-65. These subgroups are called strata, and the numbers sampled in the various strata are proportional to the size of the populations. E.g. if males aged 45-65 is known to compromise 13% of the total population in the UK, in a sample of 1000, 130 should be males aged 45-65.
On the other hand, Simple Random sampling can be defined as the process by which every possible sample of a given size is equally likely to be selected. To ensure randomness and no bias, a random number table or RAN# on a calculator is used, and the items in the sampling frame are numbered.
These two sampling methods were not used in isolation but combined to make full potential of both. For this investigation I will use a random stratified sample. This means that the data that I take the sample from is first sorted into strata and then a random sample is taken from them.
The advantage for me using this type of sampling method was that the data was already in some sort of strata e.g. year groups, gender, weight, IQ, ideal for collecting the type of data I need in answering my hypotheses. The stratified sample method doesn't really have any sort of disadvantages. This is because using this type of sampling will use all of the data and none of the data will be biased unless its numerical or alphabetic order has any relevance or affect on the results.
There are disadvantages of using a random stratified is that if the data is not in any sort of strata it cannot be used because to do this type of sampling requires strata. But this disadvantage does not affect my results since the data that I taking my sample from is already in a stratified form.
Then I have also used a random sample so therefore all of the data will be used, without there being any sort of bias. I am also using this type of sampling method on my data is because the amount of data that I have got is quite small and if a data set was large then it would mean that the random sample may not be as effective and could lead to bias.
The data that I am using is secondary data. This is because for it to be primary data it would mean I would have to collect it myself. But because I have not and I have got my data from somewhere else then therefore it is secondary data.
Total number of students: 1183
Year 11
Year 10
Year 9
Year 8
Year 7
Female
86
94
43
25
31
Male
84
06
18
45
51
Total
70
200
261
270
282
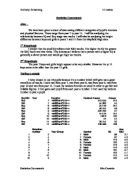
As shown above the total amount of students in the entire sample is 1183. My sample size would be 10% of the total data this is because looking at the amount of my data 10% seems to be a reasonable size. In this case 10% is 118.3, which has been rounded up to 120 for easier analysis of the data.
Below the amount of samples for each year are shown in a table: ~