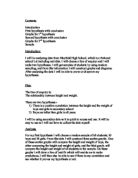
1st hypothesis: There is a positive correlation between the height and weight of boys and girls in secondary school.
For my first hypothesis, I used a random sample as I stated in my analysis before. I used the height and weight of 30 boys from years 7-11 and I used that data to construct a scatter graph showing the correlation between height and weight. I did exactly the same for girls in years 7-11 and constructed another scatter graph.
From looking at the scatter graph I constructed for boys, I can see that there is a positive correlation between the boys’ height and weight. Although it is not a very high correlation, it is still positive which means that as a boy grows taller their weight also increases.
With the scatter graph constructed for girls, there is a correlation but the data is very spread out, which means there is only a slight positive correlation between the height and weight of girls.
The scatter graph showing the height and weight of all students in my sample showed me a high positive correlation as the gradient is quite steep and the data is close together. From this graph I can conclude that my hypothesis was true, and that there is a positive correlation between the height and weight of boys and girls in secondary school.
2nd hypothesis: Boys are taller than girls in all years.
After doing my random sample, I made tally charts for the height and weight of boys and girls in order for me to see my results more clearly.
BOYS:
GIRLS:
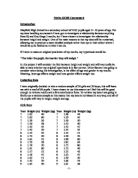
In order to find the mean height of both boys and girls, I drew out another table in which I calculated the midpoint values. I ignored heights between 100cm and 129cm as there are not any students in that height range as you can see from the results of the tally charts.
BOYS:
Mean=Total number / Total number of students
=4955/30
=165.16
GIRLS:
Mean=Total number / Total number of students
=4765/30
=158.83
From my calculations I can see that the mean height for boys is greater than those of the girls, but these means may be influenced by freak results so it is not really a very good measure of average.
After considering this, I decided to find out the median instead, so I constructed a cumulative frequency graph for boys and girls so I could compare both of them together. Here are the tables I constructed aiding me to draw the cumulative frequency graphs.
BOYS:
GIRLS:
Using the cumulative frequency graph constructed for the height of boys, I calculated the median. Firstly I halved 30, which was the number of boys in my sample and my answer was 15. Reading along and down on the graph gave me an answer of 165.6. I did the same for girls; I halved 30 and read along and down the cumulative frequency graph and the answer I got was 158. By comparing both the medians for boys and girls, I can clearly see that this measure of average shows that boys are taller than girls.
I then went on to find out the lower quartile for boys and to do this I divided 30 (number of boys in my sample) by 4 which gave me 7.5. I read along and down the graph and the answer that I got was 155.6. I then found the upper quartile by dividing 30 by 4 and then multiplying the answer by 3, which is 22.5. I read along and down the graph to find an answer of 171.3. To find the inter quartile range I calculated 171.5-155.6 (upper quartile - lower quartile) which is 15.9.
I did the same for the girls by calculating the lower quartile by dividing 30 by 4 which gave me 7.5. I read along and down the graph and the answer was 152.5. The upper quartile was calculated by dividing 30 by 4 and multiplying the answer by 3, which gave me an answer of 162.3. From these quartiles I was able to work out the inter quartile range by subtracting 152.3 from 162.3 (upper quartile - lower quartile) which is 10.
In order to see my results more clearly and so I could compare them together I drew a box and whisker diagram. The range of heights for the boys is wider than the girls and you can tell this as the lower quartile, median and upper quartile are further up the scale than those for the girls. There were some girls in my sample who had heights of up to 189cm but the overall median and quartile ranges were less than those of the boys. This shows that my hypothesis was correct and that boys are generally taller than girls in secondary school.
In conclusion my first hypothesis was correct. I can tell from the scatter graphs constructed for both boys and girls that there is a positive correlation between the height and weight of boys and girls. This means that as a teenager gets taller, their weight also increases. However in both cases, boys and girls, the correlation was positive but not very high. The reason for this may be that the results are only from 30 boys and 30 girls of the database. To obtain more reliable results, I would have to use a larger sample which would be more accurate.
My second hypothesis was also correct, as the mean and median height of the boys were greater than the girls and the box and whisker diagram also showed that boys are taller than girls.
When planning my investigation I decided to use 30 boys and 30 girls’ information to use for my hypotheses. I used random sampling for both hypotheses. To do the random sampling I used my calculator and the ‘Ran’ button which gave me a number between 0 and 1 and using that number, I multiplied it by the number of students in the year group and this gave me a random number. I used this strategy for both boys and girls. The reason I chose random sample was so that all the numbers would have had a fair chance of being picked and the sample would not have been biased.