Apparatus
We used the following apparatus: _ A meter rule, 30 Nichrome wire, seven other wires, a variable resistor, a 6 volt battery and two crocodile clips.
The measuring instruments in the apparatus list are as follows: _
Diagram
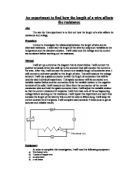
Method
We set the circuit, shown above, and ran a current through it. Then we decided what lengths of wire we should be using and the intervals between each one. Then we put the crocodile clips in the appropriate places on the wire (e.g. 5cm, 15cm) and took readings from the voltmeter and ammeter and determined the resistance from these readings.
The reason for having the variable resistor was so that we could control the resistance in the circuit. Also the reason for having a meter rule was so that we could measure the distance of wire we were using to the nearest half-millimeter. Also we kept the type of wire we were using the same or we could have got completely different readings. Furthermore we used the same battery because if we use a different one the readings will be inconsistent.
Also we will be doing the whole experiment three times just to make it more accurate and get an average resistance at the end.
After each reading we will break the flow of current so the temperature of the wire doesn’t change during the experiment. We will also do this so the wire doesn’t get too hot or someone could burn themselves. Also an obvious safety point is to not put your finger in the power socket or you might get a shock.
Although before doing this experiment we did a preliminary one so that we could find rough results; like the highest and lowest points, the range, the intervals between results and the number of results we should be using on a graph.
Results
Analysis
As there is a steady increase in the line in my graph it clearly shows that the longer the wire the higher its resistance is. This shows that resistance is directly proportional to the length. When the length increases, the resistance increases.
Conclusion
This is mainly shown in my hypothesis but briefly if a wire is short there are fewer atoms so it is easier for the electrons to pass through the wire. But as the wire becomes longer there are more atoms so there is less room for the electrons to pass through. So when the electrons bump into the atoms they lose some of their energy and therefore resistance is produced.
I think that is a very reliable conclusion as the line on my graph goes through almost all the points. Therefore the conclusion completely agrees with my prediction.
Evaluation
My graph is of very good quality as there are no anomalies and the line goes through all almost all the points and if they are not on the line they are very close.
This experiment was easily carried out so I could not think of any ways of improving it.
There are no anomalies in my graph so these results were very good and reliable. Although not all of the points are exactly on the line. This could be because we measured the length of the wire we were trying to use wrong so we got a different reading to what we wanted. Also the temperature could have gone up a bit if we didn’t dis-connect the circuit after each reading, and as we know the resistance will change if the temperature changes. Also we could have used a different cross sectional area but still changing the length. Another reason why the points were a little off the line sometimes is that we might not have measured the length of wire right as the crocodile clip gets in the way of us measuring it exactly.
To gather more relevant evidence we could have done the experiment with a different metal just to see if the resistance still went up when the length was increased. The resistance would change in this new wire depending on how many atoms were in the wire. Also we could have changed the width of the wire and I think that as the width of the wire got larger the resistance would decrease, as there would do more room for the electrons to move.