So as the length of the wire is increased the number of collisions the current carrying charged particles make with fixed particles also increases and therefore the value for the Resistance of the wire becomes higher.
I also assume that as the cross sectional area of the wire is doubled, the resistance is halved this is because the number of possible routes for the current to flow through also doubles, therefore the energy is twice as spread, so resistance might halve. (i.e.R∝1/A) ----------------------------------- 2
By combining 1 & 2, it gives R=ρL/A, where R is the Resistance of the wire measured in ohms, L is the length of the wire measured in metres, A is the cross sectional area of the wire measured in square metres and the constant ρ is the Resistivity of the wire measured in ohmmeter.
Since the material and the cross sectional area of the wire will be constant when I vary the length, I can find the Resistivity of the wire using the Formula.
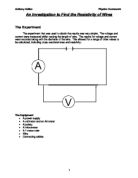
DIAGRAM
APPARATUS
- Wire over 60cm long
- Power pack supply
- Six connecting wires
- Two crocodile clips
- Two multi-ammeters
- Metre rule
- Micrometer screw-gauge
- Heat Prone mat/ White tile
METHOD
I will connect the circuit as shown in the diagram above. Then I will measure the length of wire (0.50m), using a metre rule. I will then adjust the voltage using the power pack to a range of 0.05v – 0.35v and record the current flowing through the wire at this length from the Ammeter, by using 5 different potential difference readings at this range, I will get 5 different current readings, so that I can have a wide range of points to draw my line of best fit when I plot my graph. By plotting a graph of potential difference on the y-axis against current on the x-axis, from the equation V=IR which corresponds to the equation of a straight-line y=mx. I will find the Resistance of this particular length of wire, which is the gradient of the straight-line graph.
I will repeat the experiment with the following length of wire connected firmly between the crocodile clips: 0.10m, 0.15m, 0.20m, 0.25m, 0.30m and record my result in a table.
I will then repeat the experiment again but this time I will use a fixed length of 0.10m. Using a micrometer screwguage, I will measure the diameter of the piece of wire and find the cross sectional area using the formula A=¼Πd². I will then adjust the voltage using the power pack to a range of 0.50v – 1.08v and record the current and potential difference readings in a table.
I will vary the cross sectional area and obtain five different potential difference and current readings for each by folding a 0.20m wire into two, a 0.30m wire into three, a 0.40m wire into four, a 0.50m wire into five and a 0.60m wire into six, connected firmly to the tip of the crocodile clips. I will then find the Resistance at each cross sectional area from my graphs.
ACCURACY: - To keep this experiment as accurate as possible, I need to make sure the length of the wire is measured precisely from the inside edge of the crocodile clip, making sure that the wire is straight when I do this. I also have to ensure that the wire is straight when I conduct my experiment as bends or kinks in the wire may affect my Resistance.
I also have to ensure that the readings I take of the potential difference, is done fairly promptly after the circuit is connected. This is because as soon as current is put through the wire it will get hotter, changing the temperature of the wire and thus may affect the Resistance.
SAFETY: - To ensure that the experiment is safe, I will put a heat prone mat/white tile under the wires to prevent fire hazards and I will try and keep the current, low as possible.
OBSERVING AND RECORDING
I performed the experiment as planned and was able to get the following results.
For the results of the Resistance of the wire when I varied the length.
Cross sectional Area=0.015mm²
Table of results I got when I varied the Cross Sectional Area using a wire of length 0.10m
Table of results for Resistance and the inverse of cross sectional area.
I observed that as the length of the wire was increased, the current flowing through the wire at the range of voltage used decreased, I also observed that as the diameter of the wire was increased, the current flowing through the wire at the range of voltage used also increased.
Anomalies: There were anomalies in my results and they are highlighted in red. The Resistance of the wire of length, 0.05m, did not accurately fit the trend from the graphs this may be as a result of error encountered while measuring the length of the wire, whilst holding it next to a ruler and then trying to accurately, fix the crocodile clips tip to the wire to get a good connection. The result for the cross sectional, 1.5X10⁻⁸m2 was not plotted on my graph of Resistance against cross sectional area because it did not fit the scale and I also identify it as an anomalous result. The errors for the Resistance may be as a result of fluctuation in the Ammeter and Voltmeter used.
EVALUATION
I feel that the overall my results were quite accurate. Although the Resistivity of Constantan I found when I varied the length and cross sectional area were not the same for both with an error of 4.31%. I think this error may have been as a result of the connections made between the doubled or tripled diameter of the wire and the crocodile tips, while conducting the experiment for the different cross sectional area as it was difficult to try and fit the wires firmly to the tip of the crocodile clips without actually twisting them together. This error may also have been caused by the thickness of the wire because different ends of the wires may have different thickness. I also think that temperature change may also have been a reason due to reason stated in my plan. Most of the errors on my graphs were too small to be seen.
CONCLUSION
The graph of Resistance against length was a straight line through the origin, which means R, is directly proportional to L. This means that if the length is 0.15m and the Resistance is 2.50ohms, then if length is doubled to 0.30m, Resistance also doubles to 5.00ohms.
This is because of the scientific idea stated earlier that if you double the length, you double the number of atoms therefore increasing the number of collisions, the current carrying charged particles make with fixed particles thus doubling the resistance. The results support my predictions well. Doubling the length did double the Resistance as seen in the table above. This wasn’t true for all cases as when the wire of length 0.50m with a resistance of 0.74ohms was doubled, the Resistance had an error of 12.8% and did not agree with the other results. This error may have been encountered while measuring the length of the wire. This is because it simply was not very practical to hold a piece of wire straight, whilst holding it next to a ruler and then trying to accurately fix crocodile clips to the right part on the wire.
The graph of Resistance against cross sectional Area was an inversely proportional curve, this is because R is directly proportional to 1/A as seen in the graph, this means when A doubles R halves. For example when the Cross sectional Area is 0.015mm² the Resistance is 1.67ohms. When A doubles to 0.061mm²,R halves to 0.83ohms.
This is because, as stated earlier: We see that if the Cross sectional area of the wire doubles, so those the number of routes for the current to flow, therefore the energy is twice as spread out, so the Resistance might halve, i.e. Resistance is directly proportional to 1/Area. The trend in my graphs clearly shows this. There were errors in my graph of Resistance against 1/ cross sectional area. This may be as a result of different positions of the wire having different thickness and the length of the wires used may not have been uniform as I intended and this might have had an effect on the Resistance of the wire and it’s cross sectional area.
But overall the readings were accurate and apart from the anomalous result identified with an error of ±0.10ohms in the resistance in my Resistance/length graph. This does not affect my conclusion because the trend I predicted in my plan still was shown.
I feel that the only way to make my results more accurate would be to use a different method. I could even use a rheostat in place of a wire, because it is essentially a long coiled wire that is connected at different lengths to change the Resistance of the wire. If I were to do this experiment again, I will measure the diameter of the wire at 3 different positions on the wire and take the average of the 3 values. And I will use a Digital Voltmeter and Ammeter and take a wider range of readings like about 8 readings to ensure a greater accuracy in the obtained results and in the plotted graphs. I will then repeat this experiment twice for each potential difference and current readings in a particular length of wire.
The value for the Resistivity of constantan I found is 2.56 × 10⁻⁷ Ωm. This is different from the value of Resistivity in the Data book which is 4.70 Χ 10-7Ωm, with an error of 45%. This error may have been as a result of what I talked about in my evaluation. It may also have been as a result of the different method used in obtaining this result.