- As the length increases the resistance will also increase – there is more wire resulting in more energy needed for the same results
- As the Cross-Sectional Area increases the resistance will decrease – the wire is ‘wider’ resulting in more electrons being able to flow at any one time
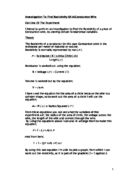
Equations
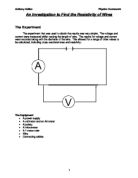
The Length of the wire was easy to measure, using a 1-metre ruler. To measure the diameter of the wire a micrometer was used, this allowed for a very accurate calculation to be made. The current and voltage were measured with a voltmeter and an ammeter. With this data I could calculate the following:
Average Voltage
This was done using the simple average formula. With the average voltage I was able to use this and obtain an average result for that particular length, diameter or current. This made the future calculations easier to carry out.
Resistance
The resistance of a conductor can be thought of as the ratio of the potential difference across it to the current flowing through it. From this we get the formula:
R = V/I
Using the results I had for the average voltage I therefore was able to calculate the resistance for each value. With the resistance I was then able to move onto calculating the resistivity. Resistance is measured in Ohms (Ω).
Resistivity
As above I have described what resistivity is. I used the formula:
ρ = RA
L
With the resistivity I could then plot graphs to display the relationship between the data. To plot some of the graphs I needed to use Length/Cross-sectional Area and 1/Cross-sectional Area as values. To work these out I simple put the data values into a formula on the computer.
The units for Length/Cross-sectional Area are m-1. The units for 1/Cross-sectional Area are m-2.
Cross-sectional area
To calculate this all I needed to do was find the radius, half of the diameter. Then I used the formula for the area of a circle, πR2.
The Graphs
Resistance against Length
This graph is a straight diagonal line. This shows that Resistance and Length are directly proportional. In other words if one value increases by a certain amount then the other value will increase by a proportional amount.
Although in this experiment there are a few anomalies, caused either by technical problems or through human error, this graph shows a strong picture of the relationship between length and resistance of a wire.
Resistance against Area and 1/Area
To start with I will analyse Resistance against 1/Area. This graph shows that the cross-sectional area and the resistance of a wire are inversely proportional. At first the shape of the graph suggests that the two values are directly proportional. However, as the area is displayed as 1/area this makes it inversely proportional. This is because the equation for something that is inversely proportional is:
A α 1/B, or in this case Resistance α 1/Area
When you look at the graph of resistance against area it shows the same thing; as cross-sectional area increases the resistance will decrease. This graph also shows that the resistance will never be zero, whatever the value of cross-sectional area.
Resistance against Length/Area
Again this is a straight-line graph. This shows that resistance and length/area are proportional. The gradient of this line is 5 x 10⁻⁹. The gradient of this line is also the resistivity of the wire. This is true also because resistance and length/area are values needed to calculate the resistivity using the formula.
There are also anomalies in this set of values. They would be caused by the same reasons as the ones above because the same set of values has been used to calculate the other values needed, resulting in mistakes being carried through.
I also plotted this graph for the second set of data, from a second experiment. In this graph there are fewer anomalies, almost none. The gradient again shows the resistivity, which is very close to that of Constantan, suggesting that this was the wire used in these experiments.
Conclusion
The change of resistance with temperature is so small normally that this factor can be ignored, except for under extreme circumstances. Therefore we are able to say that the resistance of a conductor is proportional to the length or 1/Cross-sectional area.
R α l or R α 1/A
From these two formulas we can get this one:
R = ρl
A
Here are a few examples of the resistivity of a few materials:
From the results that I got the average resistivity was 5.08 x 10⁻⁷. Looking at the table above this would suggest that the wire used in the experiment was Constantan. Although the values is not an exact match, there would have been some accuracy lost when reading the values to two decimal points, resulting in a slight error in the final calculation.
From the data I have made three observations:
- The length of the wire has a proportional effect on the resistance of the wire
- The cross-sectional are is inversely proportional to the resistance of the wire
- The length of the wire divided by the area of the wire and the resistance of a wire are proportional. Having plotted a graph of these values the resistivity of the wire can be found out by calculating the gradient of the line.
These observations can also be written as:
Evaluation
I think that the results that were obtained were good. There were a few anomalies in the graph, however these did not seem to affect the calculations too much. The graphs that I could produce with the data showed how each aspect was related to the others. The experiment used to calculate the results could have been better. For example, more readings could have been taken – i.e. every 5cm. However with the data I was given it was possible to show the relations between resistance, length, cross-sectional area and resistivity.