The p.d. across the resistance wire stays constant throughout. It is equal if the p.d. of the battery. We measure the current with different length of wire in the circuit and calculate
the resistance each time (R = V ). A graph of resistance against length is a straight line
I
through the origin. The resistance is proportional to the length.
Resistance and thickness
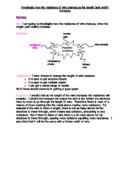
To investigate the effect of thickness on resistance, we use several equal lengths of same resistance wire. Two pieces placed side by side will have twice the cross-sectional area of a single wire, three have three times the cross-sectional area, and so on.
Using the same battery all the time (p.d. fixed),we find that the current increases as the thickness of the wire increases. It is easier for electrons to flow through the thick wire. The resistance gets less as the thickness increases. In fact, they are inversely proportional and if the cross-sectional area is doubled, the resistance is halved, and so on.
Information from, Book: Understanding Physics by Robin Miller (Pages 148&249)
From the above theory I infer that the key factors to vary are the length and the thickness of the wire and the temperature should kept constant. External temperature the wire is almost constant. I assumed that the room temperature does not fluctuate much during the time interval during which I conduct the experiment. The internal conductor varies as the current passes the wire gets heated. The resistance vary with the temperature. I assumed the internal temperature of the wire is the same for the different length of the wire.
I intend to vary the length from 5cm to 25cm and the width from 0.22mm up to 0.28mm. I intend to use constantan wire in this experiment. Constantan is an alloy of a mixture of 55% Copper and 45% Nickel. I have selected constantan because the resistance of most metal increases with temperature. Constantan is a copper based alloy and its resistance changes very little unless it is heated strongly. If two conductors at different potentials are joined by a conducting wire, electrons will flow from one to the other until both until are at the same potential. Free electrons in both conductors then have the same average potential energy. Electrons always flow from lower to higher potential, i.e-towards the more positive potential. When electrons move in this way, there is current flow. The resistance could be seen in another way. The resistance is the hindrance for the flow of electrons. As the length of the wire increases the hindrance for the flow of electrons increases. This is due to the electron s for a long distance than before. Thus we say the resistance increases. When the width of the wire increases, the hindrance for the flow of electrons increases. Because the space through which electrons flow increases. Thus we say that the resistance decreases
Preliminary
.
From this preliminary experiment I will increase the length of the wire up to 30cm in order to get the reliable results. The reason why I chose the thin wire is because to get a high resistance and therefore it is easy to measure. I have used three different widths because I want to find out width gives the best results. To get precise measurement I will measure the value of the current and voltage up to two decimal places.
Obtaining evidence
This is how the set up of my apparatus looks like. First I join everything together and check if everything is in the right place. Then I adjust the 30cm length of wire to the length of 5cm, 10cm, 15cm, 20cm and 25cm, with the help of the crocodile clip. After that I change the resistance by means of the variable resister to get an accurate measurement /result of the current and voltage for each length.
Actual experiment
.
Safety
When the experiment has been started the wire becomes hot. The safety here is to put the things (e.g. paper, books, exercise books etc. which are inflammable) to a side, so that it cannot come into contact with the wire. After finishing the experiment turn the current off.
I can use the results not with 100% certainty; I can rely only on 60%. This is in regard to change in resistance caused by the charge on the length of the wire. This is in regard to the change in resistance caused by the change in length of the wire. As far as concerning the change in resistance due to change the width of the wire are anomalous.
Analysis
My experiment shows ‘longer the wire higher the resistance’. That is, when the length of the wire increases, resistance increases. Resistance is directly proportional to the length of the wire.
Resistance of wire ∞ length of the wire
Resistance = k x length
From the above table, this numerical calculations shows that the resistance is directly proportional to the length of the wire. If I double the length of the wire, the resistance also get doubled as a result.
My experiment ,in respect of the conductor with the length of 15cm, shows that the current flow is directly proportional to the potential difference.
The voltage ∞ current
V = k I
V = k
I
At 15cm length V = k =0.78 = 0.31 =0.81
I 1.37 0.53 0.31
= 0.58
In respect of other length of the conductors (5cm, 10cm, 15cm, 20cm and 25cm) there is a variation in the second decimal of the constant figure. These discrepancies may be due to the slight changes of the external temperature of the conductor when current passes through the conductors. It may be also due to the reading of the ammeter and voltmeter by the eye.
Evaluation
My results are reasonably good as far as concerning the change of resistance due to the change in length of the conductor.
My results are fairly good as far as concerning the Ohm’s law. That is, the current passes through the conductor is directly proportional to the potential difference across the conductor provided the temperature remains constant.
My results were not at all good as far as concerning changes of the resistance due to changes in the width of the conductor.
My graph which shows the resistance and length of the conductor is a straight line which passes through the origin and 3 points. Two points stays out of the line.
For the variation of the resistant, I could not draw one line on one graph and I have drawn 5 lines on one graph. I could not draw my conclusion on the graph because the variations of the width are not great enough to produce significant variation in the resistance. Only 2 points fell on the line and the third one slipped out. If the straight line passes through 3 points on the graph we can depend on the reliability (length against resistance graph). In contrast in the width against resistance graph, only 2 points falls on the straight line. Therefore I cannot depend on the reliability. This anomaly is due to the fact that the wires which I have chosen are not considerably vary in thickness (width). Another way of doing that is to take reading using the constantan wire and then the second reading connecting 2 wires as shown in the prediction and keep on doing this for 3, 4 wires.
The anomalous points on the graph (2 points) may be due to the crocodile clips which were not properly attached. There may be lack of specification in observing the ammeter and voltmeter with the eye. There may be fluctuation in the external and in the internal temperature of the conductor.
I can use a conductor made of nichrome which is an alloy of 60% nickel, 24% iron and 16% chromium. Accurate laboratory standard are made from a coil of resistance wire inside a protective plastic case.