Predicted outcome
If the statement above about resistance being proportional to length is true, a graph of resistance against length should show resistance increasing with length in the form of a sloping straight line.
My Plan
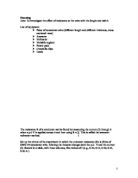
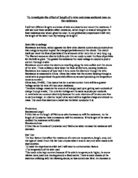
Resistance can be measured by using an ammeter and a voltmeter to measure how much current passes through a wire given voltage across the wire. So to measure the resistance of a length of wire we need a power pack to supply the voltage, a voltmeter to measure the voltage and an ammeter to measure the current. Also it is more convenient to have a method of easily changing the length of the wire - the method I will choose will be to have a movable connection in the form of a crocodile clip that could be connected at different points along the wire. The experimental set up is shown in the diagram below.
Using this approach I will connect the power pack across different lengths of the wire. Length will be measured using a 1-metre rule. I will write down the amount of amps passing through the wire and the volts measured across the connections to the wire. I will use the same equipment to make it fair when I do the investigation a second time to see if there is any difference in my results.
To find out the resistance of the wire I will be using Ohms Law
(Volts / Amps = Resistance)
It is important to demonstrate that the relationship between length and resistance covers a wide range so the plan is to measure the resistance from 10cm up to 100cm (a ratio of 10-1)
Also to gain confident in the accuracy of the results the measurements will be performed several times. If each time the results fall in the same region it will give me confidence that they are correct. Further more by taking an average of the results over the several times they’re performed it will be possible to eliminate random errors. This is based on the idea that random errors sometimes increase the error positively and sometimes negatively. Another source of errors could be changes in temperature during the course of the experiment it is assumed that this effect will not be significant, as the room temperature is quite constant.
The results
First set of results
From this table it appears that the voltage reading at 40cm and the ammeter reading at 60cm are in error this could be due to bad connections or meter reading errors.
Second set of results
Average of the two sets of results
Analysing the results
The results show that resistance increases as length increases this can be seen from the tables and the graphs. In the first table the resistance at 10cm is 0.38 ohms and at 100cm it is 3.4 ohms. In the second table corresponding values are 0.41 ohms and 3.34 ohms. The graphs are also quite close to a straight line in both cases and there is a steady increase of resistance with increasing length.
In the first table there appear to be two anomalies 1 is the voltage reading at 40cm and the ammeter reading at 60cm these and other errors are discussed below.
The third table and graph shows the average results of the first two again this shows resistance increasing steadily with length.
I have confidence in the results, as both sets of measurements are quite similar. The results taken as a whole support the prediction made when planning the experiment that it would show resistance increasing with the length. This happens because the electrons have to go through more material as the length increases.
Evaluating the experiment
As all ready mentioned I have confidence that the results are good (in that they do show an increase in resistance with increasing length) because the two sets of results are very similar and there are only two readings where the points did not fit exactly on a straight line.
Sources of Error
- The measurement of length. The ruler was marked in mm, so at the smallest length (10cm) there could possibly be an error of plus or minus 1mm. That means a possible error of plus or minus 10%.
- Another source of error in the length is that the wire may not have been pulled tight enough. This would produce errors in the length due to bends or curves in the wire.
- A further source of error would have been the use of a crocodile clip as it is difficult to position in exactly the right place. Also the crocodile clip does not grip the wire tightly this may cause resistance increase due to bad connection
- Although we used digital voltmeters and ammeters these two would have had some inaccuracy in their calibrations. This is stated on the meter or the instructions that come with it. Unfortunately I did not make a note of this at the time.
- If we assume the voltmeter was only accurate to 0.01 of a volt. At the smallest voltage reading (0.45 volts) this means an error of 2.2%. Similarly if we assume the ammeter was accurate to 0.01 of an amp. At the smallest current reading (0.40 amps) this means an error of 2.5%
- Just adding the errors from the ruler and the meters gives a total possible error of 14.7%.
- A final source of error would be due to temperature changes during the course of the experiment.
Recommendations to improve the experiment
- A more accurate method of measuring the length of the wire e.g. Vernier Callipers measuring to at least ½ a mm accuracy
- Fixing the wire in a taught position using a fastening of some kind.
- Replace the crocodile clip with some kind of gripping device that could be positioned accurately and that would make a tight connection a wire. E.g. Clamp
- More accurate meters maybe ranging down to 0.001 of a unit.
- Perform the experiment in a temperature-controlled room.
- Increasing the total length of wire to several meters this would show that the relationship holds over greater lengths but also errors in measurement of length would be less significant.
Niki Singh Science Course Work Page