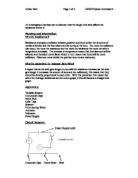
Apparatus:
Variable Resistor
2 Crocodile Clips
Metre Rule
Cello Tape
Scissors
4 Connecting Wires
Ammeter
Voltmeter
Power Supply
Circuit Diagram:
Power Supply (cell)
Crocodile Clips Metre Ruler Wire
The above circuit diagram shows how I am going to connect the circuit in order for this experiment to work. I have chosen to use the variable resistor (rheostat) in this experiment as it allows me to change the current that is running through the circuit. This allows for a fairer test as it enables me to be able to keep the current at 0.050 amps constantly. Using a will allow me to be able to measure the thickness of the wire to ensure that it is the same thickness all the way through the metre length of wire. Another way of ensuring that this is a fair test is to make sure that there are now bends in the wire as this would add to the length of the wire and cause incorrect results. I am using the metre ruler instead of any ruler as it is extremely accurate and is also the right length for the experiment I am doing. Digital ammeters and voltmeters will be used as they are a lot more accurate which makes for more accurate results and calculations.
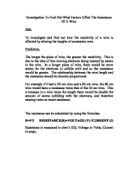
Ohms Law:
In order for me to calculate the resistance in the circuit I will need to use Ohms Law, which says:
“The potential difference across a device will be proportional to the current going through it providing the temperature remains constant”.
i.e. V = I x R or R = V/I
In order to keep the temperature constant there are two things that can be done, keep the temperature in the room constant and use a variable resistor, this will allow you to be able to easily adjust the current so that you may have the same amount of current throughout the experiment. All the testing I do will be done in the space of one day in order to ensure that the temperature does not change dramatically.
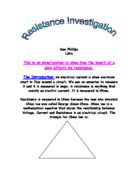
Diagram:
Wire Wire
This Diagram shows that when the length of the wire increases, so too then does the resistance of the wire increase i.e. when you double the length of wire the number of positive ions and electrons doubles too. The two rectangles are the first and second (double in length) wires. The small circles within the wire represent the positive ions, which are doubled with the doubling of the length of wire. When the ions are doubled so too are the chances for collision and with there being more ions within the wire there will also be a lot more collisions.
Actions Taken And Why:
I am going to take measurements every 10 centimetres for a total of 80 centimetres. This will give me sufficient information to plot a graph to get a visual idea of how the length of a wire affects the resistance within that wire. These measurements will be taken three times each in order to obtain an average voltage, I need to take the measurements approximately three times as taking it once would not be sufficient because the measurement taken could be an erroneous measurement in which case using it would give me incorrect results.
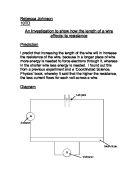
Conclusion:
My graphs show that as the length of the wire increases, so too does the resistance within the wire increase. As can be seen by the two graphs, they have both become straight-line graphs and the two measurements on the graph are directly proportional to each other. This is exactly what I predicted and proves my prediction to be correct.
Evaluating Evidence:
In order for me to improve this experiment I could have done a number of things. These include:
- Ensuring that the wire was entirely and completely straight throughout its length and had no bends in it – every bend or kink in the wire would make it slightly longer that an exact 80 centimetres and would lead to incorrect measurements and calculations,
- Ensuring that the wire was the same length throughout the length of the wire – if it was not then the resistance will be different and therefore my measurements and calculations incorrect,
- Putting the crocodile clips on properly and using the same method throughout all the measurements taken.