There are some things in this investigation that must be kept as constant as possible. These are:
Temperature.
When the temperature of a metal increases the resistance of that metal also increases. This is because when the temperature increases the atoms of the metal vibrate more vigoursly because of the increase in energy. This means that the electrons have more difficulty getting through the wire as they collide with the atoms that are in their pathway. This increases the amount of collisions therefore there is more resistance and some of this excess energy is lost in the form of heat as was found out in preliminary experiments. It was found that as the filament lamp increased in temperature the resistance also increased. However it is hard to keep the temperature exactly the same, as the room temperature might fluctuate.
It is essential to use a low voltage because it means a low current that will not heat up the wires. If a high voltage is used the energy would be lost in the form of heat which would make the experiment unfair.
The investigation will be done at room temperature.
The same apparatus must be used throughout the investigation. It is also important to take three repeats and find the mean so if any anomalous results are obtained, the others will average it out.
Apparatus.
- Ammeter.
- Voltmeter.
- Power pack.
- 2 crocodile clips.
- Wire cutter.
-
50 centimetres of constantan wire.
- Connecting wires.
- Variable resistor.
- Stop watch.
- Ruler.
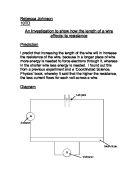
Diagram.
Method.
- Measure accurately 50cm of constantan wire and cut it.
- Set up apparatus as shown in the diagram.
- Place the constantan wire between the two crocodile clips.
- Set the voltage on the power pack to 2 volts.
- Switch on the power pack for 30 seconds and take readings from both the ammeter and the voltmeter.
- Switch off the power pack and record in results table.
- Cut 10cm from the wire accurately using a ruler and wire cutter and take readings again. Continue to cut the wire by 10 cm until there is only 10cm of wire left.
- Repeat each experiment three times to obtain more accurate reliable results.
-
Then work out the resistance by using the formulae V/I=R (Voltage/Current = Resistance).
- Plot graph to show average current against the wire length.
- Plot graph to show average resistance against the wire length.
Fair test.
- The same voltage was used for each experiment (2 volts). This was done by using a variable resistor.
- The same piece of constantan wire was used for each experiment.
- The same voltmeter was used.
- The same ammeter was used.
- The same power pack was used.
- The same connecting wires were used.
- The power was left on for the same amount of time (30 seconds).
Results.
Conclusion.
The results from the graph give a clear indication of how the resistance compares to the wire length. There is a very strong positive correlation. This means that when the length of the wire increases, the resistance also increases, thus showing that my prediction was right. The results are also directly proportional, meaning that when one doubles so does the other. An example would be: the average resistance of a wire measuring 20 cm is 0.63 ohms, and a wire measuring 40 cm, is 1.21ohms. This is almost exactly double the size.
This is explained in the prediction that in any given metal wire, there are a number of atoms and free moving electrons. Electricity is the movement of these electrons through the wire. Resistance is caused when the free electrons moving through the wire, collide with the atoms making their path through the wire more difficult. This means that if there are more atoms in the way to collide with the free electrons, the resistance is increased.
In a length of wire there will be a certain number of atoms, therefore in a wire twice the length, there will be twice the number of atoms. In turn this will lead to there being double the number of collisions between the electrons and the atoms increasing the resistance by two. This explains why the results were directly proportional.
For example a wire that was 10 cm long may have 500 atoms blocking the electrons. Therefore in a wire 20 cm long, there should be 1000 atoms meaning that the resistance had doubled.
The results that I have obtained support my prediction. This is because in my prediction I said that as the length of the wire increased, the resistance should also increase. I also said that the link should be directly proportional. The results have shown that this is true.
The line of best fit clearly shows that the results followed the expected pattern very well. The points are very close if not touching the line. This shows how the results were directly proportional through out.
Evaluation.
The experiment proved to be a success and I retrieved an accurate set of results although some results were not as accurate due to faulty/damaged voltmeters and ammeters.
Measuring the lengths of the wire was also an inaccuracy as the rulers used were not exact, and it was difficult to get an accurate reading of length by eye, as the wire may not have been completely straight. These would have also contributed to the error. These results would be difficult to improve on as they are reasonably accurate, and there were no anomalous results.
If I were to do this experiment again, I would use newer, more accurate ammeters and voltmeters, a more accurate method of measurement, and take a much wider range of readings, and more readings so that a more accurate average can be taken. I would also investigate other factors, such as temperature, voltage and current, and see how these affect the resistance. I would also use a different type of wire thickness etc. and see what difference that would make to the resistance which would make it much more interesting.
As these results had a range of only 5 readings, from 0-50cm, and were only repeated three times, I would say that these results are not strong enough to base a firm conclusion on because there are so many potential sources of errors.