Prediction
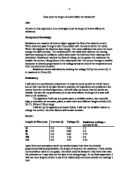
I predict that the greater the length of the wire, the greater the resistance. I predict that if I double the length of the wire, the resistance will double and if I triple the length the resistance will triple etc. My graph should show that the length of wire is directly proportional to the resistance.
Predicted Graph:
Reason for Prediction
I predict this because if I double the length of the wire, I will double the number of metal ions the electrons have to pass through. This means there will be more collisions; every time an ion collides with an electron it loses energy i.e. the longer the length of the wire the more collisions that occur, this in turn means the resistance is higher. It also means the current will take more time to flow through the wire also increasing the resistance.
Apparatus
The apparatus I am going to use for my experiment is:
- A variable resistor to change the current, which will as a result change the resistance
- An ammeter to measure the current
- A voltmeter to measure the voltage
- A d.c. power supply to provide the electricity
- 8 different lengths of 30 swg constantan wire (25, 50,75,100, 125, 150, 175 and 200cm)
- 2 crocodile clips
- A meter stick to measure the different lengths of wire
- Pliers to cut the wires
- Connecting wires
Fair Test
To make my experiment a fair test I will have only one input variable (the length of wire) and all the other factors shall remain constant:
- The current will be controlled by using the variable resistor
- I will use the same cross section area and material of wire
- The equipment I use will be the same throughout the experiment
Temperature also affects the resistance of a wire, but with the wire I have chosen to use-constantan, the temperature has no affect on its resistance so I will not have to worry about this factor.
Variables
My input variable is the factor I am changing, the length of wire. My output variable is what I am investigating, the resistance.
Range
The values of my input variable will range from 25cm (lowest input variable) to 200cm (highest input variable) of wire. I will use 8 different lengths of wire; this will give me a wide range of readings and ensure I obtain accurate results. I will use a higher range of values than I did in my preliminary investigation to see if the relationship I found is true for values outside those I used before.
Method
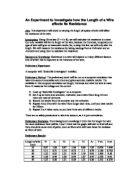
The main steps for setting up the apparatus are:
- Using the meter stick and pliers, cut out the different lengths of wires of 25, 50, 75, 100, 125, 150, 175 and 200cm
- Take a connecting wire and join one side of it to the d.c. power supply and the other to the ammeter
- Take a crocodile clip and attach the clip to the 25cm constantan wire
- Attach the other end of the crocodile clip to the ammeter so that it is connected in series
- Take the second crocodile clip and attach the clip to the other end of the 25cm wire
- Attach the other end of the crocodile clip to the variable resistor
- Using another connecting wire join the variable resistor to the d.c. Power supply
- There should now be a full circuit.
-
Using two connecting wires, connect the voltmeter in parallel with the constantan wire
- Turn the power supply on. Using the variable resistor adjust the current so that the ammeter gives a reading of 0.2
- Record the result on the voltmeter in a table
- Using the voltage and the current calculate the resistance by dividing the voltage by the current
- Turn power supply off and repeat experiment again using another length of wire
- After investigating all the different lengths of wire, repeat the experiment again with each wire. Each length must be repeated again to obtain a more accurate result
Diagram:
Safety
Safety precautions were taken to reduce the risks of accidents occurring.
- When I was using the pliers to cut the wire I was careful not to cut my fingers.
- When I was changing the length of wire being used I turned the power supply off and then replaced it so that I did not get a shock.
- I was also careful when handling the wire after using it in the experiment, as it could have gotten very hot.
- I used a low current of 0.2A in my experiment, this was to prevent the wire from getting hot so to reduce the chances of getting my fingers burnt
- I also made sure my hands were dry, because water conducts electricity (touching the equipment with wet hands would increase my chances of getting a shock).
Observations
I was observing the reading on the voltmeter. I noticed that the readings increased as the length of wire being used increased.
Results
Relationship
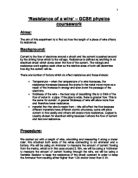
My graph shows that the relationship between the length of wire and the resistance is directly proportional. The line of best fit on my graph is a straight line through the origin, this shows that when there is no wire there is no resistance and when the length of the wire is doubled the resistance is doubled and when the length is halved the resistance is halved.
Explanation
The explanation for this type of relationship is as I explained in my Hypothesis; if the length of wire is doubled then the number of metal atoms are doubled, this means the electrons collide with double the number of metal atoms. The wire is opposing the flow of current twice as much, so the resistance doubles. If the length of wire is halved, the opposite happens; there are half the number of metal atoms as before, so the electrons collide with half the number of metal atoms, they lose less energy in doing this and reach their destination quicker, so the resistance is half of what it was before.
Comparison with Prediction
The results in my experiment support my prediction, from the data obtained in my results I can conclude that the length of wire is directly proportional to the resistance, I have explained why my results support my prediction above.
Accuracy
I think my results are accurate enough for firm conclusions to be made; most of the points on my graph are very close to the line of best fit, with the exception of one anomalous result. There were no problems using the equipment it was satisfactory and I was very careful to measure and cut the wire to the correct length.
Anomalies
I have one anomalous result on my graph, which I have circled. This anomalous result was for 75cm of constantan wire. This result does not demonstrate a directly proportional relationship, for example, the average resistance for 25 cm of constantan wire was 1.5Ω and the average resistance for 50cm of constantan wire was 3.38Ω this shows that the resistance doubled with the length, however for 75cm of constantan wire the average resistance was 3.65Ω and for 150cm of constantan wire the average resistance was 10.35Ω, this shows that the resistance did not double here. The average resistance for 75cm of constantan wire should have been approximately 5.00Ω.
This result could be because I may have miss read the reading on the voltmeter or I recorded the wrong result. Or I may have not placed the crocodile clips right at the end of the wire; they may have been placed slightly away from the ends of the wire.
Reliability of Evidence
I used a suitable range of results for my experiment. The relationship I found between my input and output variable would also be true for another set of values. I took two sets of results and both sets are very similar. If I repeated my experiment I would come up with the same set of results.
Suitability of the Procedure
My investigation could be improved by repeating the experiment more times; this would help me obtain a more accurate result. I could use an Ohmmeter, which would give me the resistance directly instead of me having to calculate it. Or to obtain even more accurate results I could use data logging, this would reduce the chances of human error.
Further Work
I could investigate the other factors affecting resistance to find out more:
- The effects of changing the cross section of a wire
- Changing the temperature of the component
- Using different materials of wire