Safety: I will ensure that none of the wires are frayed and that there is no water near any electric equipment; as in all electrical experiments. Also I will only run current through my circuit for a short period of time as if the wire becomes heated then particles begin to expand thus increasing resistance
Method: Firstly I will collect my apparatus then set it up in the circuit shown above. I placed the crocodile clips 10 cm apart on the wire for my first test and slid my rheostat to one end. Now I was ready to record my first reading so I turned on my power pack set at 4 volts, recorded the readings then snapped off the power, slid my rheostat halfway then once again recorded the reading then repeated with the rheostat on full after this I turned off the power then repeated these 3 steps 6 more times up to 70 cm. once I had done the experiment 3 times with all of my recorded results, I cleared the apparatus away then gathered all of the relevant data. From this I can conclude my results from what the graph is showing. There are also certain things that need to be kept the same or change throughout the experiment these are called variables. The exact same wire for each experiment needs to be used as any variation could lead to an inaccuracy in results due to more/less positive ions. The current needs to be changed 3 times for each length using the variable resistor/ rheostat so I can work out an average resistance for each length. The same thickness of wire needs to be used because it really affects resistance so it wouldn’t be a fair test. The same temperature will need to be kept as if we have particles expanding and contracting the test is no good, so it would be preferable for the experiment to be done as quickly as possible on the same day. The input variable is the length of wire and can be changed by adjusting the crocodile clips. The outcome variable is voltage (volts) and current (amps) and will be measured by a voltmeter and an ammeter. The range of values I will use is from 10 cm to 70 cm moving up 10 cm each time. I will repeat my experiment 3 times using exactly the same equipment to ensure a fair test and no anomalous results.
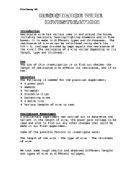
Apparatus List: Wire- This nichrome wire is what my experiment will be conducted on. It will theoretically vary in length but stay the exact same wire throughout.
Power Pack- this is needed to supply 4 volts of power to the circuit.
Croc Clips- form part of the input variable and will be moved apart to a maximum of 70cm on the wire.
Wires- these insulated wires will be conducting the electricity through the circuit.
Ammeter- forms part of the outcome variable as it will change current readings across the circuit as the experiment progresses.
Voltmeter- also is a part of the outcome variable as the voltage across the wire will change.
Variable resistor/rheostat- used to provide 3 different voltages for each length so we can work out a fair average.
Analysis: In this part of the write I am going to discuss my results and what they tell us firstly though the graph that I drew up from my results, the line of best fit tells us that the average resistance and the length go up by the same ratio so if we doubled the length of the wire then theoretically according to our results the resistance should double. This is also stated in ohms law. From this graph if you had enough paper to write the units on you could predict any length of our nichrome’s resistance within reason. When plotting my tables I needed to keep to the same degree of accuracy and not deviate which was two decimal places. As you can see in my results table I discovered an anomalous result that didn’t make sense but worked the other 2 times when we did the experiment. When I was working out the averages I omitted this result. This could have been caused by a number of reasons, faulty equipment mostly. The results from every experiment have gone as predicted in the hypothesis and have obeyed all of the previous information that is displayed in the prediction. Now using our results graph we could predict the resistance of a 15 cm wire using the line of best fit. It would be 1 ohm of resistance. In my prediction I said that “if we double the length of the wire we will double the probability of the electrons hitting the ions” this theory has been proved correct by our results graph.
Conclusion/Evaluation: Now that I have obtained my results from the 3 experiments I performed I can go on to draw a conclusion and seek out what went wrong and what needs to be improved. I think that our results fit the pattern very well, this can be determined by looking at how strong the positive correlation is on the graph and on my tables as the number patterns arise. Whether this investigation has been a success can only be determined by the accuracy of the results. Without scientifically accurate results, the investigation would be meaningless and disruptive to the person acting upon it. The results shown in this investigation are true and are believed to be correct. In this sentence ‘correct’ is also meaning as accurate as can possibly be attained. There are many ways in which this investigation could have improved its scientific standing. One way to improve the reliability and accuracy of the results would be to repeat the experiment ‘n’ times so that a true average could be obtained. The experiments were repeated to obtain an average but they were only repeated twice. This is more reliable than conducting the experiment once or twice but still more results would have given more accurate averages. If I was to do this experiment again I would be persuaded to seek out more accurate professional equipment as to improve the accuracy of our results. Such as university standard crocodile clips as well as more accurate voltmeter/ammeter that go up to 4 decimal places. Also we could use some low resistance wires and components once again to improve accuracy. As I had one anomalous result this could have occurred due to faulty equipment but also after we had performed experiment 2 and totaled up the results from all three something didn’t look right, it was found that the rheostat for that experiment was faulty so that was properly accounted for. Although this display of controversy is founded, the experiment was very reliable and efficient. There is no way to improve the method of the experiment used as a basis for all of the experiments. It was a perfect method of calculating resistance although there are some negative technicalities, which were explained above. For the purpose of allowing the equation…
R = V / I
...to be calculated there is no better substitution although scientific knowledge of how resistance is calculated to extreme military precision is regrettably absent. The experiment was simple, quick and effective. Possible changes in the investigation were noted earlier. The results are true and so is the conclusion. How I could do more experimental work is by doing investigations such as more lengths of wire, different types of wire e.g. copper, aluminium also I could see at different temperatures, how that directly affected results as well as seeing how resistance is inversely proportional to area so using a thicker wire, the possibilities are endless. Apart from the above brief demonstration of negativity, the investigation was a success. After examining the basic out come of each experiment in the summary. Overall it was a success. The aim was to see whether “the length of a wire affects resistance” and among other factors I think we can safely say yes it does. The following equations have been verified:
R = V / I
(Resistance (Ω) = Voltage (V) / Current (I))
R µ L
(Resistance is proportional to length)
By Simon Hinchcliffe