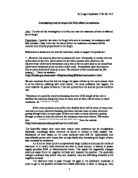
Cross sectional area of the wire - If the cross sectional area of the wire increases, then it will have an effect on the resistance by decreasing it. By increasing the cross sectional area of the wire, you are increasing the distance between the atoms of the wire, meaning that there is more room in the wire for the electrons to pass through without colliding with the atoms of the wire, and hence losing some of their charge.
Substance of the wire - If the substance that the wire is made from changes then it can have an effect on the resistance. This is because different materials have different resistances. For example nickel chrome has a greater resistance than constantan, and copper has smaller resistance than constantan. The substance of the wire can affect the resistance, because some materials may have their atoms more spread apart, or more tightly packed. If the atoms of the wire are more spread apart then it means that there is more room for the electrons to pass through the wire without colliding with the atoms of the wire, and hence losing some of their charge.
Method
I will set up the apparatus and build the circuit in the way shown on the diagram.
Figure 1 – Circuit diagram showing the setup of the apparatus
The two crocodile clips will be connected to the two electrical wires that will be connected to the coil of constantan wire (shown by the resistor symbol).
The length of coiled wire will be placed in the beaker of water. I will do this to keep the temperature of the water at a constant, if I do not keep the temperature of the water at a constant, then my results may be affected by the temperature of the wire and therefore will not be accurate. The water in the beaker does not need to be measured; it only needs the cover the wire in the beaker.
I will change the resistance on the variable resistor, until the voltmeter reads 1.00V. I will then record the reading shown on the ammeter. The resistance on the variable resistor will then be changed until the voltmeter reads 2.00V; the reading shown on the ammeter will then be recorded. This process will be repeated for the voltages 3.00V, 4.00V and 5.00V.
Preliminary work
Prior to conducting the actual experiment, I conducted preliminary work using the method that I described above. The preliminary work influenced my decisions on the measurements and accuracy of readings. The table below shows the results of the preliminary work.
Wire material
I have chosen to use nickel chrome wire (also known as nichrome wire) instead of constantan or copper wire because nickel chrome wire has a higher resistance than constantan wire and copper wire. Because nickel chrome wire has a higher resistance means that I do not have to account for the resistance of the electric leads as much as I have to do for constantan wire and copper wire.
Measurements
For this experiment I will use the following lengths of nickel chrome wire: 20cm, 40cm, 60cm, 80cm and 100cm. The thickness of this nickel chrome wire will be 30swg (standard wire gauge). I will take 5 readings on each wire. These readings will be conducted at 1V, 2V, 3V, 4V and 5V. I have chosen this range because it is suitable for me to make a graph.
The minimum length of wire will be 20cm because 20cm was long enough for the wire to coiled, without wire (when coiled) becoming ridiculously small (in such a way that I could not attach the crocodile clips to it effectively). It also gave me a reasonable reading that I could use. 100cm was chosen as a maximum, because I needed a minimum of 4 measurements to be able to draw a graph. Also if the length of the wire was greater than 100cm then it would be difficult to measure the wire accurately.
Accuracy of readings
I will take the accuracy of my readings to 2 decimal places; I will do this because the voltmeter and ammeter display the readings to 2 decimal places. I will also make sure that I use equipment that is working before hand.
Accuracy of experiment
I will make sure that none of the coils are touching each other as this will cause a short circuit, and produce wrong results. I will also make sure that I use fresh pieces of wire for each experiment that I conduct. When I cut the wire, I will cut the wire slightly longer than needed, so that I can add space for the crocodile clips to be attached. This will prevent the wire from getting shorter when attached. Also when cutting the wire, I will mark the start and end of length needed with a black permanent marker so that I can see where I need to attach the crocodile clips to. I will also make sure that there are no kinks in the wire. If there are kinks in the wire then it is possible that the thickness of the wire could have changed, which would have an effect on the resistance. Finally I will make sure that the temperature of the water is constant. By keeping the temperature of the water constant, I am reducing the chances of the temperature of the wire increasing.
Obtaining evidence
1st set of results
2nd set of results
Average resistances of both sets of results.
Analysing evidence and drawing conclusions
I can see a definite trend in my results. As the length of the wire increases so does the resistance. This is shown by looking at the results. We can see that when the length of the wire was 20cm and the voltage was 1.00V, we can see that the resistance was 1.52Ω. When the length of wire was 40cm and the voltage was 1.00V, we can see that the resistance was 4.35Ω. Finally when the length of the wire was 60cm and the voltage was 1.00V, the resistance of the wire was 9.09Ω. I can also state that there is a very strong positive correlation between the voltage and current and resistance. However, I have disproved parts of my hypothesis. I have disproved the part about the resistance being proportional to the length of the wire. If we look at the results for the 20cm wire, we see that when the voltage is 1.00V, the resistance is 1.52Ω, however when the length of the wire is 40cm, and the voltage is 1.00V, the resistance is 4.35Ω. 4.35Ω is not double 1.52Ω. Therefore resistance is not proportional to the length of the wire.
Another part of my hypothesis that I have disproved is resistance being directly proportional to the voltage and the current. If we look at the results for the 20cm length of wire, and we look at the resistances, we see that they are different. If we look at the resistances for the 60cm length of wire, and look at the resistances, we see that they are different. This shows that the resistance is not directly proportional to the voltage and the current. Also on the graphs, not all of the results fall into a straight line.
The resistance increased as the length of the wire increased because of the electrons having to travel further. When the electrons had to travel further, they had to travel through more of the particles of the wire. This caused more collisions between the electrons and the particles in the wire, which in turn slowed down the flow of electrons through the wire and increased the resistance.
By comparing the graphs that I have produced to the hypothesis, I can say that I have proved one part of my hypothesis. However I have disproved the other parts of my hypothesis. I have disproved the part about direct proportionality between the resistance and the voltage and current in a length of wire because the results on the graph do not form a straight line. The other parts of my hypothesis that I have disproved are the quantifying part and the proportionality between the length of the wire and the resistance. I have disproved the quantifying part because my results show that when I double the length of the wire, the resistance does not double. I have disproved the proportionality part of my hypothesis, because the points on the graph which has the average resistances shown against the length of the wire are not in a straight line which shows proportionality.
Evaluating evidence
Evaluating the results
I am not happy with my results, because they did not allow me to fully prove my hypothesis. I think that my results are not accurate because they did not allow me to fully prove my hypothesis. I do not think that the method that we used was the most accurate method. I think that a more accurate method was to just have one variable (the length of the wire)
From the evidence produced by the experiment, I can say that my results were accurate, and that there were no anomalous results on graphs of the individual wires. My results were accurate enough in the way that they allowed me to produce a graph for each length of wire and produce a suitable average. From this, I can say that my plan has worked well, as it has allowed me to get the results that I need without having any anomalous results. nother way that I could improve my results would be to make measure the distance of the wire between the crocodile clips before cutting the wire.
Extensions to the investigation
If I was given more time to carry out this experiment, I would also want to investigate the resistance of brass wire and compare it with nichrome wire. I would also like to investigate whether the resistance increases as the length of the wire increases continuously or whether there is a point where resistance doesn’t increases (this is similar to Hooke’s law).