Therefore I can now produce a set of predictions for distance d using the values of h and θ in my experiment. Then a comparison can be made between the theoretical results and the experimental results.
To make the calculations simpler, the equation is to be rearranged into a simpler form.
h = dtanθ + ____d²____
4lsinθcos²θ
4lsinθcos²θh = dtanθ×4lsinθcos²θ + d²
In my experiment, h = 0.724m θ = 44º
4×lsin44º×(cos44º)²×0.724 = dtan44º×4lsin44º×(cos44º)² + d²
1.04l = 1.388dl + d²
d² + 1.388dl – 1.04l = 0
when l = 0.250m
d² + 1.388dl – 1.04l = 0
d² + (1.388d ×0.25) – (1.04×0.25) = 0
d² + 0.347d – 0.26 = 0 ∴d = 0.365m
when l = 0.375m
d² + (1.388d ×0.375) – (1.04×0.375) = 0
d² + 0.521d – 0.39 = 0 ∴d = 0.416m
when l = 0.500m
d² + (1.388d ×0.50) – (1.04×0.50) = 0
d² + 0.694d – 0.52 = 0 ∴d = 0.453m
when l = 0.750m
d² + (1.388d ×0.75) – (1.04×0.75) = 0
d² + 1.041d – 0.78 = 0 ∴d = 0.505m
when l = 1.000m
d² + (1.388d ×1.0) – (1.04×1.0) = 0
d² + 1.388d – 1.04 = 0 ∴d = 0.540m
when l = 1.250m
d² + (1.388d ×1.0) – (1.04×1.0) = 0
d² + 1.735d – 1.3 = 0 ∴d = 0.565m
when l = 1.500m
d² + (1.388d ×1.0) – (1.04×1.0) = 0
d² + 2.082d – 1.56 = 0 ∴d = 0.585m
when l = 1.750m
d² + (1.388d ×1.0) – (1.04×1.0) = 0
d² + 2.429d – 1.82 = 0 ∴d = 0.601m
when l = 2.000m
d² + (1.388d ×1.0) – (1.04×1.0) = 0
d² + 2.776d – 2.08 = 0 ∴d = 0.614m
So this is the set of predictions made from the theoretical equation
h = dtanθ + ____d²____
4lsinθcos²θ
where l is the variable.
Conducting the experiment:
Apparatus used:
- a length of semi-circular piping
- clamp stand and clamps
- a object that will slide easily down the slope – a block
- a tray of sand
- metre sticks
Method:
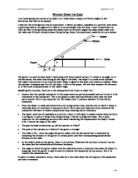
The apparatus is set up as shown in the diagram on the previous page. Clamps are used both at the beginning and at the end of the piping to secure it, so when the block is released down the piping, the direction of the movement of the block won’t be affected. The length of the semi-circular piping is measured first, then for every 25cm from the end of the piping, a line is marked with a marker and they are the positions that the block is going to be released. The angle θ that the piping makes with the horizontal is measured and recorded to the nearest degree and it’s kept the same throughout the whole experiment. The length h is also kept constant; it is measured by using a metre stick which is placed perpendicular to the ground, so the height can be measured to the nearest 0.1cm.
Before the actual experiment is carried out, a testing is done to ensure that the apparatus are working properly. Since there are clamps along the side of the piping, by doing the test, I can make sure that the clamps do not affect the motion of the block as well as the direction of the piping doesn’t change. Also before each experiment, a test is done to see if the block falls into the tray of sand or not. If it doesn’t, the position of the tray would then have to be adjusted.
The variable in this experiment is the distance l from the end of the piping. The front of the block is placed just behind the marked line one the piping and is released. Then the distance d, from the end of the piping to where it landed in the tray of sand, is measured. When measuring d, a metre stick is placed parallel to the edge of the table and the other metre stick is placed perpendicular to it, this is to ensure that the distance d is measured as accurately as possible. It is measured to the nearest 0.5cm because when the block hits the tray of sand, I can not be absolutely sure where exactly does the block first hits the sand, so to minimize this error in the measurements, they are all rounded to the nearest 0.5cm. However, since this can cause a significant error, so repetitions of the experiment are considered to minimize any possible errors. The experiment of each distance l is carried out five times, and an average will be taken as the final result in order to improve the accuracy of it. A repetition of five times should be enough to obtain a fairly accurate result and is also assumed that it is representative of the whole group of results. The highest and the lowest values of d for each distance l are ignored because they are the least accurate out of the five measurements. So using the three measurements that are left, a mean average can be worked out. Before each experiment, the tray of sand is levelled out first, so the point in which the block hits the sand is as clear as possible.
To ensure that the values are of good quality and to minimize the human error in reading the measurements, it is the same person who releases the block each time and the same person to take all the measurements.
Error Bounds:
Since the height h is measured to the nearest 0.1cm and is measured to be 0.724m in the experiment. Therefore the error bounds for the height hm are given by
0.7235≤ h < 0.7245.
Similarly the angle θ that the piping makes with the horizontal is to the nearest degree. So its error bounds are 43.5º ≤ θ < 44.5º.
Results:
The table below shows the results obtained from the experiment.
θ = 44º h = 0.724m
Another reason for taking several measurements is to allow for random variation. Looking at the table of results, none of the experiments have 5 measurements that are the same, except for 0 because it is an exception. This variation in the measurements is expected because the block behaves differently each time, maybe due to the sand. Since there are variations, error bars are used to indicate the estimated error and the uncertainty in the measurements.
The graph on the next page shows the experimental results with error bars. l is plotted on the horizontal axis because it is the variable in the experiment. The maximum and minimum values for each l are plotted. These values are obtained from the three measurements that are left. Looking at the graph, the variations in the measurement of the shortest distances l are the highest suggesting that they are the least accurate out of all the measurements.
To compare the theoretical results with the experimental results, a graph is to be plotted with both sets of results on the same graph. The theoretical results are the values that I’ve calculated earlier using the equation:
h = dtanθ + ___d²_____
4lsinθcos²θ
Looking at the graph, both sets of results have produced a smooth curve going through the origin. This is expected because when the block is released from the end of the piping, i.e. l = 0, the block should fall straight down to the ground without travelling any distance horizontally, therefore d should also be 0. The graph shows that all the results for the experimental distances are lower than the theoretical one. This can be explained because in the experiment, we have assumed that there is no friction acting on the block. However in reality, there is dynamic friction, which is the resistance to continuing relative movement between two bodies in contact, acting on the block as it slides down the piping. Therefore the block did not travel as far as it was predicted due to friction and maybe air resistance.
As l increases, both graphs start to level off, this is because the speed of the block is also increasing which in turns causes the resistant to increase as well. Therefore this increase in resistance to the block’s motion causes the difference in distance d to decrease each time.
In this graph, I’ve included the error bars as well. The maximum value of d for each distance l is closer to the theoretical values although there isn’t a huge difference between the maximum and the mean values.
In conclusion, there is a good match between the experiment and the model because the results obtained from the experiment are very similar to the theoretical results, despite friction was not included, the graph produced by the experimental results has the same shape as the theoretical one. Therefore it is suggesting that the match between them is good.
To improve the match between the model and the experiment, friction is to be taken into account. So that a value of µ, coefficient of friction, can be calculated. However certain assumption has to be made in order to calculate µ and that is friction is constant along the piping. However this value is not very accurate because it is found by assuming that the forces acting on the block is constant and the block is on the point of sliding.
(↑) R = mgcosα
(→) Fr = mgsinα
since Fr = µR
mgsinα = µmgcosα
sinα = µcosα
µ = sinα_ ∴µ = tanα
cosα
(where α is the angle of which the block is about to slide)
To find the value of α, a simple experiment is carried out. The same block is being used and placed on the piping. Then one end of the piping is gradually raised so it is tilted at an angle to the horizontal. At the point just before the block starts to slide down, the angle is measured to the nearest 0.1 degree. It is assumed that wherever the position of the block is on the piping, the angle of point of sliding is always the same. The experiment is repeated five times and again, both the highest and the lowest values are ignored, and the mean average is worked out using the three measurements that are left.
∴ α = 15.3º
So using µ = tanαº
= tan15.3º
µ = 0.274 ( 3d.p)
Since the angle α and the value of µ are worked. So I can now find an equation to calculate distance d for each distance l including friction in it. So hopefully the results obtained would be closer to the experimental results than the theoretical results do.
Before the experiment is carried out, I’ve assumed that no energy is lost. However in reality, energy is not conserved when the block is sliding down the piping because some of the energy has gone to overcome friction if friction is taken into account. So we cannot assume that PE = KE.
∴work done against friction = change in energy
Energy at top of slope: KE = 0 PE = mgh
Engergy at bottom of slope: KE = ½ mv² PE = 0
∴ Fr × l = mgh – ½ mv²
In the previous page I’ve worked out that µ = tanα
R = mgcosθ
Substituting these in the formula Fr = µR gives
Fr = tanαmgcosθ
Referring back to the original equation for work done
Fr × l = mgh – ½ mv²
tanαmgcosθl = mglsinθ – ½ mv²
gltanαcosθ = glsinθ – ½ v²
½ v² = glsinθ – gltanαcosθ
½ v² = gl (sinθ – tanαcosθ)
v² = 2gl(sinθ – tanαcosθ)
v = √[2gl(sinθ – tanαcosθ)]
As the block acts as a projectile, the following equation can be used
s = ut + ½ at²
d' = vcosθ t + ½ ×0×t² (d' = distance travelled including friction)
h vsinθ ½ ×g×t²
d' = vcosθt
h = vsinθt + ½ gt²
Substituting the expression of v into the equation above
h = [√2gl(sinθ – tanαcosθ)]sinθt + 4.9t²
Using the same values of h and θ from my previous experiment and the value of α that I’ve just found, a range of values for d can be calculated.
h = 0.724m θ = 44º α = 15.3º
when l = 0.250m
0.724 = [√2g ×0.25(sin44º - tan15.3º×cos44º)]sin44ºt + 4.9t²
0.724 = 1.085t + 4.9t² (taking only the positive value of t)
t = 0.289s
d' = vcosθt
= [√2gl(sinθ – tanαcosθ)]cosθt
= [√2g ×0.25(sin44º - tan15.3º×cos44º)]cos44º × 0.289
∴ d' = 0.325m
Using the method above, I’ve calculated a range of values for t and d for each distance l as shown in the table below.
After calculated d', a graph is plotted with both the experimental results and the distances calculated including friction.
From the graph above, it is showing that the values for the distances including friction, d' are very similar to the experimental distances. This is suggesting that there must be another resistant force acting on the block apart from friction. That’s because it is that resistant force that’s causing the difference in the values of the two results. However it is to be taken into account that since α, the angle at which the block is on the point of sliding, is assumed to be constant along the piping might have caused some inaccuracy in the values of d', distances travelled including friction. Therefore to show that those values are still representative, I’ve plotted a graph with the experimental results, theoretical results and results including friction on the same graph as shown below.
It is clear from the graph that the values of distance d' including friction is closer to the experiment results than the values of the theoretical distances are to the experiment results. However this is expected because beforehand, I’ve assumed that there is no friction so the calculated distance travelled by the block is further than it actually does. Therefore the theoretical results are higher than the experimental distance for all distances l. After noting the difference in the values, a new equation is set up to calculate another set of values for distance d which includes friction in it. And as expected, these values are all smaller than the theoretical ones because friction, the resistant force on the block, has prevented it from travelling any further and some of the values calculated are actually reasonably close to the experimental values.
In conclusion, the experiment has been successful and it shows that there is a good match between it and the model. However it has been improved by including friction and graphs are drawn to show the improvement in the values of d, horizontal distance travelled by the block.