My prediction is that if the length of the wire is increased then the resistance will also increase. I also predict that if the wire is doubled in length then the resistance will also double. I think this because if there is double the amount of wire then there is also double the amount the atoms that electrons have to pass through. This means electrons are going to collide double the amount. Therefore the relationship between the length of wire and resistance of the wire will be directly proportional.
Testing:
Through my understanding of resistance I know the factors that will affect the resistance, these are:
• Length of wire (Variable)
• Material of wire (Constant)
• Thickness of wire – SWG (Standard Wire Gauge) (Constant)
• Voltage applied (V) (Constant)
• Temperature of wire (Constant)
I decided to use the length of the wire as the factor that I will change, this is because it will give the widest range of results. I decided to test the resistance of wire using increments of 100mm of constantan. Constantan is an alloy metal made of copper and nickel. I will start at 100mm and go up to 1000mm on the same piece of wire to ensure a fair test and give a wide range of results. My reason for using constantan is that I already know it has a noticeable resistance. I know this from the research I did before conducting the experiment. It would not be a wise choice to use copper as the material of wire because copper has a low resistance therefore I would need to use very long pieces of wire before a noticeable change in resistance was visible. The thickness of wire, or SWG, I will be using is 28 SWG. This is 0.375mm thick and should be the most suitable for this experiment. The voltage I will be applying is 1 volt, according to the power pack. During the preliminary experiment the volt meter recorded a voltage of about 1.5 volts. If a too high voltage is applied then the wire will become very hot and affecting the resistance of the wire, using a too low voltage will not give accurate results. The reason for trying to keep the temperature of the wire as constant as possible is because if heat energy is given out then we know that energy is being transferred elsewhere, therefore the results would be inaccurate.
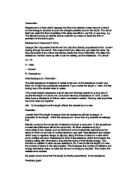
This diagram explains how the experiment will be setup.
As the DC power source I will be using a power pack connected to the mains to ensure a constant voltage supply. The amp meter will be connected in series in the circuit and the volt meter will be connected in parallel in the circuit. I will be using digital meters so I have a very accurate reading. During the preliminary experiment we tried measuring the volts on the ’20 V’ mark and the ‘2000 mV’ mark on the meter to see which would be best to take results from. Logically we would get more accurate results on the ‘2000 mV’ mark because if the output voltage was 1.5V then it read on the meter as 1500.00 mV whereas if it was on ’20 V’ it would read as 1.50. Therefore we would be able to read 1.56723V on the ‘2000 mV’ mark but not on the ’20 V’ mark. When conducting the experiment we noticed that the reading was constantly changing on the ‘2000 mV’ mark and we could not get a reading. So we decided to use the ’20 V’ mark as the reading did not change as much, therefore a more accurate reading. It was exactly the same when measuring amps too.
The constantan wire will be taped to a wooden ruler measuring in mm and a length of 1000mm. I have chosen a wooden ruler to ensure the circuit is not shorted, as wood doesn’t conduct electricity. A crocodile clip will be used to determine where the circuit is connected, the diagram explains how.
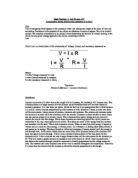
To measure the resistance in the wire I will be using the formula
R = V / I
• R = Resistance, measured in Ohms (Ω)
• V = Voltage, measured in volts using a volt meter (V)
• I = Current, measured in amps using an amp meter (A)
Analysis
As you can see from the tables I have set out the results are similar for each person that recorded the results. There does not appear to be any major anomalies and very few readings are the same for each person’s results. You can also see very clearly from the graph that my prediction is right, as the length of wire increased the resistance increased. Although I was right I was not perfect in saying that if the length of wire was doubled then the resistance would double. From the tables and graph you can see that it is not the case, but very near.
On my graph I have drawn a line of best fit. The diamonds on the graph represent the readings of each person’s results for resistance. It appears that only 3 sets of results are plotted onto the graph. All 4 sets of results have been plotted onto the graph but where the results of 2 people are near enough or the same then the diamonds overlap each other, therefore only seeing 1 instead of 2. For example the resistance measured at a wire length of 1000mm from Claire and Grant is exactly the same at 4.69 Ω.
My scientific theory was correct. When a lonely electron is all by itself in the outer shell, it can easily separate from the rest of the atom and go roaming around, this makes the atom positively charged. This 1 electron as well all the other free electrons from other atoms can move around each other. When a DC (direct current) power source is connected to a piece of copper wire electrons are attracted into one end of the wire to complete positively charged atoms, because electrons are negatively charged they create a neutral atom again. The free electrons are pushed along the wire and the same amount of electrons comes out the other side of the wire that is also connected to a DC power source to create a circuit. As electricity, moving electrons, pass through the atoms that make up the Wire the electrons collide with other electrons and atoms, this causes the electrons to move slower therefore there is a resistance of electricity through the wire.
The results did not turn out exactly how I expected though. I thought that when I produced my graph the points would go in a straight line, but it didn’t. Instead between 0mm and 300mm it was slightly higher than expected. Then from 400mm to 600mm it was slightly lower than expected. Then it was slightly higher again between 700m and 1000mm. This could be because of imperfections in the wire. I know that it wasn’t because the person did not measure correctly because all the results were the same. All were slightly high, then low, then high again.
Evaluation
From my results I now know how I could have made it better and more accurate. To begin with I made the right decision to use digital meters. I chose digital not analogue so I could record exact results, rather than guessing the reading from a needle.
I chose a wooden ruler to measure with so I could be sure it would not short the circuit, meaning it would not make any connections between the wire and the ruler.
I didn’t however make the right choice of using crocodile clips to connect to the wire. The width of a crocodile clip is about 3mm, so when connecting it to the wire it could easily make results incorrect. The crocodile clip could be 3mm either way of each measurement. If some one was measuring it at 100mm it could be possible that the clip was at 97mm or 103mm. This makes all the readings unreliable. It would have been a wiser choice to use something with a point, so the width would be less than 1mm. This would make the results much more accurate and reliable.
The most important thing in the test was the wire. We carefully thought out what type of wire and what thickness it would be. But we only tested one strand of wire. As explained before the results were not exactly as expected. The wire could have had imperfections in the width of it. Or there could have been a kink or bend in the wire. If I was to conduct the experiment again I would do the experiment on about 3 or 4 different pieces of wire to ensure that results were accurate and unreliable.