Plan of Investigation into factors affecting the resistance of a wire
Investigation into factors affecting the resistance of a wire
Aim: During this investigation, I will measure the resistance of a wire whilst changing two factors of the wire. These will be the length and the thickness of the wire. I will therefore try to find out what factors affect the resistance of a wire.
Apparatus: Constantan wire / 28-36 gauge / 0-100cm
Multimeter
Crocodile clips
Connecting leads
Ruler
Wire cutters
For this investigation, I will use a multimeter to measure the resistance of the wire. The wire I will use will be constantan. The gauges will be 28-36 going up in intervals of 2. The length will be from 0cm-100cm going up in 20cm intervals. I will also use crocodile clips to connect the wire to the multimeter.
When measuring resistance in the length of the wire the independent variable is the length of the wire and the dependant variable is the resistance. The factors that I will keep the same are:
i) the temperature (although the resistance in constantan is quite constant over a wide range of temperatures.)
ii) the thickness of the wire
iii) the type of wire
When measuring the resistance in the thickness of the wire, the independent variable is the thickness and the dependant variable is the resistance. The factors that I will keep the same are:
i) the temperature (although the resistance in constantan is quite constant over a wide range of temperatures.)
ii) the length of the wire (50cm)
iii) the type of wire
I will repeat each experiment twice to make sure that my readings are correct and that there will be no rhode points. I will take the average of the two readings and then plot them on a graph.
As the length of the wire increase, I think that the resistance will increase. I think this because the electrons have to travel further and it will be more difficult because there will be more atoms for the electrons to pass. As it gets hotter, it will also be harder for the electrons to pass the atoms as the atoms will be moving around a lot more and much faster.
As the thickness of the wire increases, then the resistance should decrease. This is because the electrons have more chance of passing the atoms because there are more channels available for the electrons to go through. The more channels there are also allows more electrons to travel through the wire at the same time.
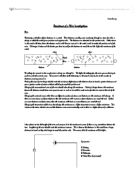
My circuit:
The crocodile clips and the connecting leads can affect the fairness of the experiment. They are a different type of metal from the constantan wire and may have different properties and therefore different resistance. Therefore the resistance of the constantan wire will show up on the multimeter as more than it actually is. To solve this problem, I will find out the resistance of the connecting leads and crocodile clips before each experiment and minus it from the overall resistance of the constantan wire plus the connecting leads plus the crocodile clips.
a - b = c
a = overall resistance of constantan wire, crocodile clips and connecting leads
b = overall resistance of crocodile clips and connecting leads
c = resistance of constantan wire
When converting gauge readings to mm, the conversion is only accurate to 3 decimal places.
When cutting the length of the wire, it is only accurate to the nearest 0.1cm.
I will use 50cm of wire when measuring the resistance in the thickness of the wire.
Voltage is not used in this experiment as it will heat up the wire and affect the results. Therefore a multimeter is more accurate, although it still has inaccuracies in that it can only measure up to 1 decimal place.
I know that resistance is inversely proportional to area.
Therefore: resistance proportional 1/area
I will try to make my measurements as precise as possible by using accurate measuring equipment.
I will do a preliminary test to check that my ranges and numbers of readings are appropriate and to get an idea of what readings I will get.
When I measure resistance in the length of the wire, I will use 34-gauge wire because this will give me a wider range of readings unlike in the lower gauge wires.
Electrons don’t ‘stick’ to the atoms in the metal very well and so there are many free electrons in the metal. These electrons have to ‘jump’ past other atoms in order to pass through the wire. This jumping causes the resistance. Hence, a wire twice as long will have twice as many atoms to jump past and should ideally have twice the resistance. Therefore if we double the thickness of the wire, we are effectively doubling the amount of channels for the electrons to pass through and therefore halve the resistance.
I will use a multimeter to measure the resistance of the wire as it will not pass voltage through the wire and therefore it should not heat up the wire.
If there are double the atoms, there should theoretically be double the electrons to pass through the wire and hence the resistance will decrease.
After my preliminary experiment, I have decided to use 34-gauge wire for the length experiment as it has a bigger range of values for resistance than the 28-gauge wire.
I drew a graph for my preliminary experiment and I found that the line doesn’t pass through the origin. This is because there is the resistance in the connecting leads and crocodile clips and I forgot to minus that.
The Teacher said "Excellent". The Student said " Excellent". This Essay was awarded a mark of A
Physics investigation of resistance
Physics Investigation Of Resistance
Aim: to investigate how the electrical resistance of a wire changes in relationship to it’s length.
Prediction: I think that as the length of the wire increases so to will the resistance of it. I also believe that the rate at which the resistance of the wire increases will be directly proportional to the length. The graph to show this should therefore look something like this:
Reason: with electricity, the property that transforms electrical energy into heat energy, in opposing electrical current, is resistance. A property of the atoms of all conductors is that they have free electrons in the outer shell of their structure. All metals are conductors and have an arrangement in similar form to this:
As a result of the structure of all conductive atoms, the outer electrons are able to move about freely even in a solid. When there is a potential difference across a conductive material all of the free electrons arrange themselves in lines moving in the same direction. This forms an electrical current. Resistance is encountered when the charged particles that make up the current collide with other fixed particles in the material. As the resistance of a material increases so to must the force required to drive the same amount of current. In fact resistance, in ohms(R) is equal to the electromotive force or potential difference, in volts (V) divided by the current, in amperes (I) – Ohm’s law.
As the length of the wire is increased the number of collisions the current carrying charged particles make with fixed particles also increases and therefore the value for the resistance of the wire becomes higher. Resistance, in ohms (R) is also equal to the resistivity of the wire, in ohm-meters (ñ) multiplied by the length, in meters (l) divided by the cross sectional area, in square meters (A).
The material and cross sectional area of the wire is constant throughout the experiment. Therefore it is clear from the formula that the resistance should be directly proportional to the length.
Key factors: in this experiment we will only change one factor, the length of the wire. This should effect the resistance of the wire in the ways stated above.
Fair test: in this experiment we are only changing one factor – the length of the wire, the factors that we are going to keep the same are as follows:
We must keep the surrounding room temperature the same or the particles in the wire will move faster (if the temperature is increased) and this will therefore have an effect on the resistance.
The cross sectional area of the wire must be kept constant throughout as well. This is shown in equation (2) where the cross sectional area is a factor that effects the resistance.
The material of the wire must also be kept the same as different materials have different conductivity. The last two factors will be kept the same by using the same wire all of the way through the experiment.
The current that we pass through the wire is to be kept the same, also. If this is changed the temperature of the wire might change in a way that is not constant making the results more confusing.
Apparatus:
1. Wire, over 50 cm long
2. Rheostat
3. Power supply
4. Six connecting wires
5. Two crocodile clips
6. Voltmeter
7. Ammeter
Plan:
1. Connect circuit as shown in the diagram.
2. Adjust rheostat until the ammeter reads .3 A.
3. Record voltage on voltmeter
4. Repeat the experiment with the following lengths of wire, connected between the two crocodile clips:
- 10 cm
- 15 cm
- 20 cm
- 25 cm
- 30 cm
- 35 cm
- 40 cm
- 45 cm
- 50 cm
5. Use Ohm’s law to find the resistance of the wire, equation (1).
Diagram:
Safety: this is not a very dangerous experiment but despite this you must always handle electricity with care, keep the current low, handle with dry hands etc.
Accuracy: to keep this experiment as accurate as possible we need to make sure, firstly, that the length of the wire is measured precisely from the inside edge of the crocodile clips, making sure that the wire is straight when we do this. We must also make sure that the wire is straight when we conduct the experiment. If it is not, short circuits may occur and bends and kinks in the wire may effect the resistance, also. The reading that we take of the voltage should be done fairly promptly after the circuit is connected. This is because as soon as a current is put through the wire it will get hotter and we want to test it when heat is effecting it the least, i.e. at the beginning.
Preliminary: upon testing to see if the experiment would work I found no problems with the plan I described earlier. I was able to get the following results:
LENGTH
(cm) CURRENT
(A) VOLTAGE
(V) RESISTANCE
(=V/I(Ù))
10 0.3 0.13 0.43
15 0.3 0.20 0.66
20 0.3 0.27 0.90
25 0.3 0.35 1.16
30 0.3 0.42 1.40
35 0.3 0.48 1.60
40 0.3 0.57 1.90
45 0.3 0.60 2.00
50 0.3 0.68 2.26
Observations
Observations: we will observe the reading on the voltmeter change as we change the current to .3 A. we also observe a general increase in the voltage as the length of wire we use gets longer. The rheostat will also be set at different positions for the different lengths of wire that we use.
Evidence: to make sure our overall values are as accurate as possible we will repeat our readings 3 times and then take the mean resistance of the 3 readings. We will also be able to spot and discard any anomalies from our results.
Results:
Set (i)
Length
(cm) Current
(A) Voltage
(V) Resistance
(=V/I in Ù)
10 0.3 0.13 0.43
15 0.3 0.20 0.66
20 0.3 0.27 0.90
25 0.3 0.35 1.16
30 0.3 0.41 1.36
35 0.3 0.48 1.60
40 0.3 0.56 1.86
45 0.3 0.62 2.06
50 0.3 0.69 2.30
Set (ii)
Length
(cm) Current
(A) Voltage
(V) Resistance
(=V/I in Ù)
10 0.3 0.13 0.43
15 0.3 0.20 0.66
20 0.3 0.27 0.90
25 0.3 0.35 1.16
30 0.3 0.42 1.40
35 0.3 0.49 1.63
40 0.3 0.57 1.90
45 0.3 0.61 2.03
50 0.3 0.70 2.33
Set (iii)
Length
(cm) Current
(A) Voltage
(V) Resistance
(=V/I in Ù)
10 0.3 0.13 0.43
15 0.3 0.20 0.66
20 0.3 0.28 0.93
25 0.3 0.34 1.13
30 0.3 0.40 1.33
35 0.3 0.48 1.60
40 0.3 0.57 1.90
45 0.3 0.62 2.06
50 0.3 0.70 2.33
Average
Length
(cm) Resistance (Ù)-Set (i) Resistance (Ù)-Set (ii) Resistance (Ù)-Set (iii) Mean Resistance
(Ù)
10 0.43 0.43 0.43 0.43
15 0.66 0.66 0.66 0.66
20 0.90 0.90 0.93 0.91
25 1.16 1.16 1.13 1.15
30 1.36 1.40 1.33 1.38
35 1.60 1.63 1.60 1.61
40 1.86 1.90 1.90 1.89
45 2.06 2.03 2.06 2.05
50 2.30 2.33 2.33 2.32
Anomalies: there was only one real anomaly in this experiment and it has been highlighted like this: 000
Analysis
Trends: from the graph we can see one very clear trend, which is, as the length of the wire increases so does the resistance of it. Another, more significant thing is that it the increase is constant. This is indicating by the fact that the line drawn is a straight one. One may also note that the gradient of the line drawn is (1.85/40) .04625.
Conclusion: I think that from my results I can safely say that my prediction was right. The resistance did change in proportion to the length. This is because as the length of the wire increased the electrons that made up the current, had to travel through more of the fixed particles in the wire causing more collisions and therefore a higher resistance. We can work out what the resistivity of the wire should be from our results using the formula
It is obvious from the formula that R/l is simply the gradient of the graph, therefore
Evaluation
I feel that overall our results were quite accurate. This is can be seen when we look at the graph, which shows a straight line with all of the points apart from one being very close to or on that line. The one point that was not that close to the line was a slight anomaly, but it was only slight and did not effect the final gradient of the graph. I have found out that for the wire I was using, the resistivity at 20©C is 4.9 X 10⁻⁷ ohm-meter. From this we can then work out the percentage error of our results:
The accuracy for this experiment is, theoretically, ± 15.7%, but as one can see this does not seem to be the case from looking at the graph. The reason for this could have been due to a number of different factors. Firstly the temperature of the wire was not necessarily 20©C when we conducted the experiment and the material of wire may not be as pure as it should have been. The main reason for this was probably due to the equipment that we used being inaccurate. This did not stop us from seeing the trend, though, because the equipment would have been out by a constant amount each time therefore there was a constant error. So the trends that were predicted in the plan still were shown.
Most errors in our experiment were encountered in the measuring of the wire. This is because it simply was not very practical to hold a piece of wire straight, whilst holding it next to a ruler and then trying to accurately fix crocodile clips to the right part on the wire. Also I do not feel that the crocodile clips were always fixed securely to the wire with a good connection. This also meant that they were easy to move about on the wire changing the length of it. Errors rarely occurred in the setting of the current and the reading of the voltage. It was just in the preparation area that they did occur. Another example of this is the wire was never totally straight when we started the experiment, which may also, as said earlier on, effect the resistance of it.
I do not think that doing any more results in our experiment would have made it any more accurate. I feel that the only way to make it more accurate would be to use a different method – perhaps were we had a bar that did not bend in place of the wire. We could even use a rheostat in place of the wire, because it is essentially a long coiled wire that is connected at different lengths to change the resistance of the circuit
This essay was written atSOUTHALL. The Teacher said "WELL DONE SON !". The Student said " HEAVY, HEAVY COURSEWORK". This Essay was awarded a mark of 28/30 ( just an A* )
Resistance of a Wire
Physics Investigation
The Electrical Resistance of Wires
Plan
Introduction
In this investigation I will be looking at the resistance of wires to an electrical current and determining the factors that affect the resistance of a wire.
There are five main factors that affect the resistance of a piece of wire. These are as follows:
1) The material that the wire is made of.
2) The length of the wire
3) The thickness (or diameter) of the wire.
4) The temperature of the wire.
5) Voltage of the circuit.
However, in my investigation I will only be looking at two different factors that affect the resistance of the wire. These two factors are length of the wire and thickness of the wire.
Apparatus
For this investigation I will need several pieces of apparatus, these are as follows:
1) A ruler (to measure the length of the piece of wire that is being used).
2) Wires (to connect the circuit together)
3) A voltmeter (to measure the voltage in the circuit.
4) An ammeter (to measure the current in the circuit).
5) A rheostat or variable resistor (to give more accurate control of the voltage in the circuit than the power supply)
6) A power supply (to supply power to the circuit and to give a variable voltage)
7) A role of Constantine wire.
Method
In this investigation I will do as follows:
As I will be investigating one variable at a time, I will need to keep the other variables constant. When measuring the length I will always use the same material: Constantine wire. Also I will make sure that the wire does not get hot by not measuring any less than 10cm. Also, I will always use the same thickness wire, 30SWG (standard wire gauge). However, when I am looking at the factor of thickness I will make sure that the wire does not get hot, that the wire is Constantine wire and that the wire is always a set length, 20cm long.
I need to keep the variables that I am not looking at or measuring the same at all times because of the fact that if I have two variables varying at the same time then I will not know which variable affected my results or how much it affected them. Because of this I will only be looking at one factor at a time to make sure that my results are as accurate and true as possible.
In both factors I will always be using the same voltage throughout.
I will look at the factor of length first. In this I will keep the variables that I am not investigating the same so as to make it a fair test. Then, I will set up my circuit without a variable resistor. If the power supply alone does not give me enough control over the voltage to get it at the optimum voltage for this investigation I will use a rheostat to give more precise control. (See next two pages for circuit diagrams.) Then, I will take readings of the voltage and current from the voltmeter and ammeter when the wire is 10cm. From this I will work out the resistance of the piece of the wire by using the following equation.
R = V
I
Where R = Resistance (Ohms)
V = Voltage (Volts)
I = Current (Amps)
This equation gives me the resistance. Then, I will repeat the experiment with a 15cm piece of wire and work out the resistance of that. I will do this with pieces of wire 10cm, 15cm, 20cm, 25cm, 30cm, 35cm, 40cm, 45cm, 50cm and 55cm long to get a good range of readings and results.
When I will measure the affect that thickness has on the resistance of a piece of wire I will do the experiment with 24SWG, 26, 28, 30, 32, 34 and 36SWG thickness Constantine wire.
Predictions
My hypothesis for the investigation concerning the length is this:
As the wire gets longer, the resistance will increase. This will be in direct proportion and will produce a straight-line graph.
I think that this will happen as a resistor works like this:
As the electrons move through the resistor, they bump into atoms. This makes the resistor hotter and is what causes the resistance. The longer the piece of wire, the more atoms for the electrons to bump into there will be and the resistance will therefore increase. The graph that I will plot should be a straight-line graph; according to OHM'S LAW. The graph should look like this:
Ohm's law states that for some conductors, the current flowing is proportional to the voltage, provided that the temperature does not change. For example, if you double your length of wire, then the resistance will also double. Doubling the length of wire is like putting 2 resistors of equal resistance in the circuit instead of one.
My prediction for the other factor that I am going to investigate, thickness, is this:
As the thickness of the wire increases, the resistance will decrease.
This is inverse proportion. I predict that this will also give a straight-line graph but going downwards instead of upwards. The graph should look like this:
I think that this will happen because of the fact that the thicker the wire, the greater the number of electrons that will be able to travel through it at one time.
Results
Testing the thickness:
Using a 50 cm long piece of Constantine wire:
SWG Voltage Current Resistance
24 0.60 0.58 1.03
26 0.81 0.54 1.5
28 0.87 0.37 2.35
30 1.02 0.31 3.29
32 1.63 0.39 4.18
34 1.98 0.32 6.19
36 2.37 0.26 9.11
Testing the Length
Using 28 SWG thickness Constantine wire:
Length V I R
100 1.71 0.37 4.62
90 1.54 0.37 4.16
80 1.37 0.37 3.70
70 1.19 0.37 3.21
60 1.03 0.37 2.78
50 0.87 0.37 2.35
40 0.70 0.37 1.89
30 0.53 0.37 1.43
20 0.36 0.37 0.97
10 0.19 0.37 0.51
Using 30 SWG thickness Constantine wire:
Length V I R
100 2.02 0.31 6.52
90 1.83 0.31 5.90
80 1.62 0.31 5.23
70 1.42 0.31 4.58
60 1.23 0.31 3.97
50 1.02 0.31 3.29
40 0.82 0.31 2.65
30 0.63 0.31 2.03
20 0.43 0.31 1.39
10 0.23 0.31 0.74
The Graphs
Testing the Thickness using 50cm Constantine wire:
Testing the Length using 28SWG Constantine Wire
Testing the Length Using 30SWG Constantine Wire.
Analysing the Data
Length
From my results and my graphs I can see that as the length of the wire increases, the resistance of the wire also increases. As my graphs gave a straight line at all times and points, I can say that the resistance is directly proportional to the length of the wire.
Because R is directly proportional to the length, I can say that if the length is 10cm and the resistance is 0.5Ohms, when the length of the wire is 20cm, the resistance should be 1.0Ohms.
These results support my prediction.
Thickness
From my results, I can see that as the SWG increases the resistance decreases. Therefore we can say that the thickness is inversely proportional to the resistance, as the thickness increases the resistance decreases. This was as I expected. However, in my prediction, I predicted that the graph would be a straight line and in my actual results my graph turned out to be a curve. Because of the fact that the graph is inverse proportion, I can say that if you double the SWG then you will half the resistance.
My results support part of my prediction (that the resistance will be inversely proportional to the thickness) but not the part that states that the graph will be a straight line graph.
Evaluation
In my investigation, I only investigated two of the different factors that affect the resistance of a wire. However, there are more than that, as I stated earlier on in my plan. There are also the factors of Material, Temperature and Voltage to be investigated. I could have extended my investigation further by also looking into and testing these other 3 factors. However, I only investigated 2 factors, the length and thickness.
Length:
I think that overall, my results were fairly accurate but definitely could have been more accurate. This table shows my results against some ideal results. This shows the margin of error in my results.
Using 28SWG Constantine wire.
Length cm My results Ideal results
100 4.62 5.0
90 4.16 4.5
80 3.70 4.0
70 3.21 3.5
60 2.78 3.0
50 2.35 2.5
40 1.89 2.0
30 1.43 1.5
20 0.97 1.0
10 0.51 0.5
As you can see from this table, my results were no more than 0.38 Ohms out from the ideal results. For 30SWG, the results were slightly less accurate but nevertheless were accurate enough to produce a good directly proportional straight line graph.
I could have made more accurate results and a more varied set of results by doing the experiment at more than just 28SWG and 30SWG. This would have given more varied results at different thicknesses. I could have made my results more accurate by doing the experiment multiple times (perhaps 5 times) and taken the average of each set of results. This would have given me more accurate results.
Inaccuracy in the results may have been due to the fact that the equipment used may not have been working properly. Also, when measuring the length of wire to be tested, it is possible that I may have slightly misread the length on the ruler by a couple of millimetres because of kinks and twists in the wire making it nearly impossible to get a perfectly straight piece of wire. This may have caused slightly inaccurate results.
Thickness:
My results for testing the thickness were, on the whole, quite accurate. There is only one result that seems to cause a "bump" in the curve on the graph: 30SWG. This could have been due to an inaccurate length of wire, a temperature change or an inaccurate reading. However, the other results produced a good smooth inversely proportional curve. If I were to conduct this experiment again I would have used more accurate equipment and tested more lengths at more SWGs than I did to give a more varied set of results.