Theory:
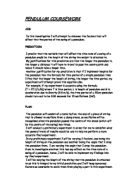
My prediction is backed up from a scientific theory I found on the web:
When the pendulum is at the top of its swing it is momentarily stationary. It has zero kinetic energy and maximum gravitational potential energy. As the pendulum falls the potential energy is transferred to kinetic energy. The speed increases as the pendulum falls and reaches a maximum at the bottom of the swing. Here the speed and kinetic energy are a maximum, and the potential energy is a minimum. As the pendulum rises the kinetic energy is transferred back to potential energy. The speed of the pendulum decreases and falls to zero as it reaches the top of its swing, with the potential energy a maximum again.
A small amount of energy is lost due to air resistance as the pendulum swings. This means each swing is slightly smaller than the one before.
There are two forces acting on the pendulum bob. Gravity tries to pull the bob downwards but this is resisted by the tension in the string. As there are only two forces they can only be balanced when they are in opposite directions. This only occurs when the pendulum is in the middle of its swing, so for the rest of the time the two forces are unbalanced; hence the bob swings back and forth.
Apparatus
- Clamp Stand
- Meter ruler
- G-clamp
- Stop Clock
- Cork
- String
- Mass
I am convinced that all the apparatus is safe. There are no safety tips
Method
- Firstly set up clamp stand, with a piece of string 20 cm long (surrounded by a cork to keep string in control), attached to it. Making sure that the G-stand is tightly secured to table and the clamp stand.
- Firstly start with a mass of 100g, and make sure it is attached securely to the end of the string.
- The mass is held 15cm to the right from the centre (45 degrees), and then released.
- This will be repeated a number of times, each time making the sting longer, from 20cm-70cm (each time going up in tens), and also increasing the weight up to 500g (going up in hundreds).
- Right down results. Altogether I will take 30 results, which are investigated 3 times each, making a total of 90 results. This will include masses from 100g-500g (going up in hundreds) and the length tested will be from 20cm-70cm (going up in tens)
I personally feel this the right amount of results, as I will be covering different lengths while at the same time measuring each length with different masses, giving me an idea what may affect the period. It will also make it a fair test, as I am going to test each results three times.
Obtaining my Evidence
I used the method intended in my plan, taking three readings of each value
and measuring the time taken for 10 oscillations rather than for 1. During the
testing, I observed that each oscillation for the same length of string
seemed to be equal. This showed that the pendulum did not slow down as the
number of oscillations increased.
I had to my sure that my results were accurate; so I had to make sure each stage of my experiment was working smoothly. There were many things I had to observe and make sure were correct. The string had to be measured with a meter ruler, to the exact cm. When I was measuring I had to make sure I measured from the top of the string to the bottom of the mass.
I needed to keep a measurement of exactly 15cm, (90 degrees on the right side), from the middle of the stand. This would give me a good indication from where to start timing and to finish timing after 10 full swings.
The stop clock will be used to measure the period truthfully. The period
has to be measured in seconds, with the stop clock measuring to the degree
of two decimal places of a second. I have performed this when I drew out my results table.
I had to my sure that the mass was measured using five 10g, to ensure that the mass
remained constant throughout the experiment. All equipment was used safely, as I made sure the clamp was secure, so movement of appuartus did not interrupt the experiment.
I recorded my results at the back of my exercise book. I listed each colum required and made sure each result was clearly written as then I would find it easier to write my results in neat. My group all decided that we would re-record if there were a result that was usual.
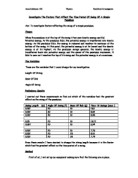
Results
On Results Table. On the results table, I have marked two numbers in pink, these two numbers are the numbers which I will find the average with, as they’re the closet.
After finding the results of 10 swings, I needed to find the results of 1 period. I did this by dividing the average by 10. I am writing the results for 1 period because this what I am investigating.
Analysis
I took three readings with the same length and at the same mass, and did this for each mass and each length, this would give me more reliable results. To find the average I selected the to closest numbers from the three, added both up and then divided by two.
For example:
On this example Test 1 and Test 3 have the closest answers, so these are the two results I will use in this case. I will do the same for the rest of my results. After finding the Average of 10 swings, I turned the average into 1 period. I did this by diving the average by ten.
As all my results were accurate, I had no need to repeat any of them.
Using the results from my table, I thought it would be useful to draw a graph, to prove my prediction, and to show what had been obtained from the experiment. My graph does not show a perfect straight line through the origin, so I drew a line of best fit to show this. All five graph clearly shows a positive correlation, which backs up my prediction and theory, it show that when the length of the string increases in size the time for a full period increases. This shows that my experiment was very useful, and it was very successful. It also shows that my results were sufficiently accurate and I had used the correct apparatus, and so I think my method was very pleasing. My experiment indicates that the time of a full period varies directly with the length of the string, when all other factors remain constant. I think graph 3 shows the best results, as it has the most impressive ‘line of best fit’.
Evaluation
The evidence obtained from my experiment supported my prediction that as
the length of the pendulum increases, the period increases. This is also shown
in my graph, as it shows a positive correlation, which backs up my prediction and theory. It shows that when the length of the string increases in size the time for a full period increases.
Some of the results were not accurate, this could have been due to human error. Had there been any strange number of results, I would have repeated my results. However I felt there was no need.
I think the human reaction time played the biggest affect on out results. Depending on human reaction time, the measurement of the period time could have been measured inaccurately, due to slow or to quick reactions when timing the stop-clock, also boredom may have affected the results, as the pupil may have been tired or collecting results, which make slow reaction time.
I think there might have been an error in measurement of angle of altitude. My group found it very difficult to measure the angle and it was even more difficult to get the exact same angle for each result.
I think we might have made errors in the measurement of string, we should of checked twice if the measurement of the string was measured correctly, making sure we measured from the bottom of the cork to the bottom of the mass.
Next time I think to make my experiment better I could have a person who has a good reaction time, I could have marked off the points with a pen to ensure they were as accurately measured as possible when I was measuring the string.
Overall I felt my methods and results were reliable. This helps me conclude my experiment, by proving that the only factor, which affects the period of a simple pendulum, is its length. As the length increases, so does the period.