Resistance is measured in ohms. The symbol for ohms is the Greek letter omega Ω.Resistance was discovered by George Simon Ohm (1787-1854) a German physicist was researched electrical current in circuits.
The basic law of current flow is ohm’s law. Ohm’s law was named after its discoverer George Ohm. George Ohm discovered that the amount of current flowing through a circuit is directly proportional to the electromotive force (volts) impressed on the circuit. Also it is inversely proportional to the total resistance of the circuit. George Ohm also discovered that the circuit also resists the flow of electricity.
George Ohm discovered a rule for working out the resistance of a circuit :
V/I = R
V = volts
I = current
R = resistance
Also you can use this simple triangle to work out the resistance :
V,I and R are still equal the above.
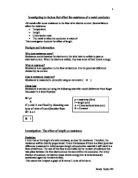
Key Variables
There are three key variables involved in this investigation. They are independent, fixed and dependent.
The Independent is the factor that is changed. So the independent variable is the length of the wire because the length is not kept constant. This variable can also be called the input variable.
The Dependent variable is the factor that is measured. Resistance of different length wire is the dependent variable, because this is what I am measuring. This can also be called the output variable.
The fixed variable is the factor that is kept constant. The temperature is the fixed variable because this is what I am going to keep constant. If the temperature is not kept constant the resistance will increase. The temperature will be kept constant using ice, which will be placed inside a sealed test tube. The wire will be wrapped around the test tube. Also the diameter of the wire will be kept constant, along with the material the wire is made out of.
In this investigation the lengths of wire that I will be using are:
40cm, 50cm, 60cm, 80cm and 100cm. I have chosen to use these lengths because each length is 0.5x more then the start length each time. 50cm is 1x bigger than 40cm. 60cm is 1.5cm bigger than 40cm. 80cm is 2x bigger than 40cm. 100cm is 2.5x bigger than 40cm.
In the investigation I will also take 2 readings and then an average. This will reduce any anomalous results occurring.
Apparatus
The apparatus that will be used in this investigation is:
- Digital Voltmeter 0-20V – measures voltage across the wire.
- Digital Ammeter 0-10A – measures current flowing through the wire.
- Power Pack
- Boiling Tube
-
Variable resistor 0-25 Ω.
- Crushed ice
- Circuit board
- Constantia wire
- Crocodile clips
- Connecting wire
- Circuit board
- Insulation tape
- Rubber bung
- Switch
Fair Testing
To make sure that this investigation is a fair test:
- Use the same material each time (Constantia wire)
- Keep the diameter of the wire the same
- The temperature must be kept constant.
- Must use new wire each time. Old wire may still hold an electrical charge which would affect the resistance.
- Don’t let the wire touch as this causes the wire to short out decreasing the length of the wire.
- Switch the power supply on for the same amount of time.
- Stop taking readings after all of the ice has melted.
Ice will be used to keep the temperature constant. Ice is used because its temperature stays constant until all of the ice has become a liquid. Therefore when of the ice has melted and become a liquid the temperature rises. That's why the investigation has to be stopped when all of the ice has melted.
To stop the wire touching I will place insulation tape around the wire as it is being wrapped around the test tube. This will stop the wire from moving around which means that the wire will not touch and short out.
Safety
To make sure that this investigation is safe the following aspects should be taken into account:
- Don’t touch the wire and the boiling tube just after the investigation has been done because the wire will still be hot.
- Don’t use faulty wires or a faulty power pack.
Method
The method that I will use in this investigation is
- Collect the apparatus and check that all of the apparatus is working.
- Set up the apparatus
- Set the power pack to 4. (This means that the voltage won’t be too high)
- Place 40cm of new wire around the boiling tube, checking that none of the wire is touching as this will decrease the length of the wire.
- Position the insulation tape around the wire.
- Put the ice inside test tube and seal with a bung.
- Turn on power pack, ammeter and voltmeter.
- Push switch so that the current flows into the circuit.
- Take first reading from the voltmeter and ammeter.
- Repeat reading.
- Find the average of both readings.
- Record results in a table
- Adjust the variable resistor to increase the current.
- Repeat what has previously been done.
- Adjust the variable resistor three more times.
- Repeat for 50 cm, 60cm, 80cm, and 100cm.
- Plot a graph of results and draw a line of best fit.
Below is a labelled diagram of the experiment:
Variable
Battery Resistor
Switch
Voltmeter
Ammeter
Wire
Boiling Tube Constantia
Wire
Ice
Prediction
Using my scientific knowledge on resistance I can make a prediction. I predict that the wires which measure 40cm and 50cm will have a low resistance respectively, because there is a shorter length for the current to travel. Meaning less collisions between the atoms of the wire and the electrons of the current. Also the electrons do not have to squeeze together for a long amount of time, because these lengths of wire are only short. Also as the lengths of these wires are only short, as the electrons squeeze together to be able to pass through the wire, there will be less collisions between electrons and other electrons, because there is only a short distance for the electrons to travel.
Using my scientific knowledge I predict that the wires which measure 80cm and 100cm will have the highest resistance respectively because there is a long length which the current has to flow along. As a result there will be a large number of collisions occurring between the atoms of the wire and the electrons in the current. Adding to this the electrons have to squeeze together for longer than they do in a short wire to be able to pass along the wire, resulting in more collision between electrons and other electrons because there is a long distance for the electrons to travel.
Finally I predict that the 60cm wire will have a resistance that is greater than that of the 40cm of 50cm wire, yet will have a smaller resistance than the 80cm or the 100cm wire. I predict this because 60cm lies between the long wires and the short wire. This means that the resistance of the 6ocm wire will not be high however it will not be low.
I predict that the graph will show a strong positive correlation. I predict this because as the voltage increases the current also increases.
This is how I think the graph will look:
Analysis
After completing the experiment I have discovered that my prediction that the 40cm wire would have the lowest resistance and followed by the 50cm wire was correct. These two lengths of wire had the lowest resistance because there was a shorter length for the electrons in the current to travel. Therefore there would be fewer collisions occurring between the positive atoms of the wire and the negative electrons of the current. Also the electrons don’t have to squeeze together for a long time, because compared to the other wires which are a lot longer in length, there is only a short distance to travel. The graph displays that the 40cm and 50cm wire had the smallest resistance respectively, because the lines which represent these two lengths have the least steep gradient. These results show that my planning worked . The results illustrate that placing the ice in the boiling tube, and then wrapping the wire around the boiling tube worked in stopping the temperature rising. The graph also supports this because the gradient of these two lines which represent these two lengths was not at all steep.
On the other hand my prediction that the lengths of wire measuring 100cm and 80cm would have the greatest resistance respectively, was incorrect. I predicted that these two lengths would have the highest resistance because there is a longer length for the current to travel along. This would result in the current carrying the electrons taking longer to travel along the wire. Also the collisions between the atoms and the electrons would occur more frequently because there would be more atoms in the wire, because the lengths of these two wires were longer than the other lengths used. As these lengths are very long the electrons would have to squeeze together for a long time to be able to pass through the wire. I predicted that there would be more collision between electrons and other electrons, because the electrons have to squeeze together for a long time.
Despite all of this evidence the 60cm wire had the greatest resistance. The graph illustrates this because the gradient for the 60cm line is the steepest out of all of the results. This was an unexpected result. I didn’t expect the 60cm wire to have the most resistance because the 100cm wire is 40cm longer and the 80cm wire is 20cm longer. The 100cm wire and the 80cm wire are a lot longer than the 60cm wire therefore the two lengths should have had a higher resistance. This result suggests that the theory that placing the ice inside the boiling tube and then wrapping the wire around the test tube to stop the temperature from rising doesn’t work. However if this is true why didn’t the 4ocm wire and the 50cm wires have a higher resistance. I think that placing the ice inside the boiling tube did stop the temperature rising therefore stopping the resistance from rising. Another reason why the 60cm wire was an anomalous result is that this wire could have already been used. If this is true the wire might have still held an electrical charge. This would increase the resistance of the wire. Another reason why the 60cm wire the highest resistance is that the ammeter and the voltmeter could have been read incorrectly.
One reason why the 100cm wire and the 80cm wire had a smaller resistance than the 60cm wire is that the coils of wire could have touched. If this did happen the length of the wire would be shortened. The current would take the easiest route, this being the shorter one meaning the current won’t have taken long to travel along the wire. The more coils that touched the more the length of wire would have been shortened. There would have been less collision between the atoms of the wire and the electrons of the current. Also as the current won’t have had as far to travel the electrons won’t have had to squeeze together for as long as predicted. If this did happen I predict using the graph that the 100cm wire was decreased to an estimated 58cm, and that the 80cm wire was reduced to an estimated 55cm. I cannot prove that this is true, it is just a prediction.
The sketch below shows what the graph looked like:
The sketch below shows how I expected the graph to look:
Evaluation
I think that the 60cm, 80cm and the 100cm wires were all anomalous results. I think that all of these results are anomalous because the 60cm wire had a higher resistance than the 80cm and the 100cm wires , however the 80cm and 100cm wires had a lower resistance than the 60cm wire. I cannot tell which of the above statement is correct.
The results could be anomalous because the ammeter and voltmeters were read incorrectly. Making the 60cm wire have a higher resistance than it should have had, or resulting in the 80cm and 100cm wires have a lower resistance than it should have had. The coils of wire on the 80cm and the 100cm wire could have touched, resulting in the length of the wire being shortened. This therefore would reduce the resistance of the wire because the current would take the easies route, which is the shortest instead of taking the longest route around the coil. This means that there would have been less collisions between the atoms of the wire and the electrons of the current. Therefore the current would have flowed faster than expected. Also as the electrons wouldn’t have had as far to travel as predicted they wouldn’t have had to squeeze together for as long, meaning there would have been less collisions between electrons and other electrons.
The 60cm wire could have already been used. This means that it could have still held an electrical charge which would increase the resistance of the wire. Also all of the ice in the boiling tube could have melted meaning that the temperature would have increased, resulting in the resistance being increased.
If I could repeat the investigation again there would be a number of changes that I would make. One of these changes would to decrease the lengths of the wire. The 100cm wire was too long and it was difficult to wrap the wire around the boiling tube without any of the coils touching. Also I could have used a bigger boiling tube that had a wider diameter. It would be easier to wrap the wire around the boiling tube without any of the coils touching.
Also if more repetitions were done there would be less chance of anomalous results appearing.
If I did the experiment again I would change the ice after each experiment. Therefore none of the ice would melt completely and the temperature wouldn’t rise
I don’t think that the voltmeter and ammeter were read incorrectly because there are no massive changes in the two reading on the table.
If I was to repeat the investigation I would make sure that the wire was new wire that hadn’t been previously used and that the wire came from the same strip.
I wouldn’t change my graph because I fell that it is clear and easy to see where each length of wire is.
Bibliography
Below is a list of web sites that I used to fin out background knowledge for the investigation:
www.essaybank.co.uk
www.goggle.com
www.sciencefinder.org
www.sciencenet.org
Here is a list of books that I used in my investigation:
- Coordinated Science – Physics
Also I use Encarta 99 to find out information for the investigation.