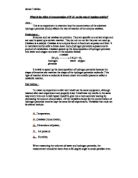
Temperature,
Catalase Concentration,
Dimensions of potato,
Air pressure
Humidity.
When measuring the volumes of water and hydrogen peroxide, the measurement should be taken from a 90-degree angle to avoid parallax error.
Method: -
To test out how the concentration of hydrogen peroxide affects the rate of reaction first set up the apparatus and prepare the different concentrations of hydrogen peroxide as below:
Concentration of Hydrogen Peroxide Volume of Hydrogen Peroxide (cm3) Volume of Tap Water (cm3)
25 25 0
20 20 5
15 15 10
10 10 15
5 5 20
And for a control
0 0 25
Apparatus:-
Cork borer,
Scalpel,
250 cm3 Glass Beakers,
Glass Thistle Funnel,
Graduated Measuring Cylinder,
250 cm3 Glass Cylinders.
Digital Stop clock,
Tap and Distilled Water,
Plastic rule.
Safety Goggles.
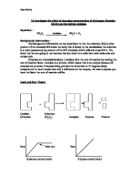
1. Using the cork borer, take a sample of potato, cut this piece in cm intervals using the scalpel and plastic rule. Then cut these a further 2 sections, so there are now 5 sections per 1cm piece of potato. Using distilled water; allow the potato discs to stick to the side of the glass thistle funnel.
2. Fill a beaker with about 4cm of the pre-made measured solution of hydrogen peroxide and using the graduated measuring cylinder, completely fill the 10 cm3 cylinder with the same solution.
3. Immerse the thistle funnel into the beaker with the steam below the surface of the hydrogen peroxide over the funnel stem.
4. Measure the volume of oxygen evolved in a time of 5mins.
5. Repeat the procedure with the other hydrogen peroxide solutions. Take care not to contaminate any solution with another, as this would cause inaccurate results.
6. Repeat all the tests at least three times (time dependent) so that an average can be obtained.
Note all the results in a table such as the one below.
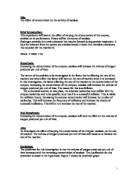
This gives the rate in cm3 of oxygen produced in the time of 5 minutes, this is because I am timing how much oxygen gas is given off in the space of 5 minutes for the various concentrations of hydrogen peroxide.
From these results, a graph can be plotted with concentration on the x-axis and the volume of gas released on the y-axis.
Interpretation
When the concentration of hydrogen peroxide is increased, the rate of reaction increases at a directionally proportional rate until the concentration of hydrogen peroxide reaches about 10vol.
If the concentration were doubled, I would expect the amount of oxygen released to be a figure twice as much.
From 25vol to 10vol shows a directionally proportional decrease in reactivity rate. After 10vol the rate of reaction slows down. This is shown by the gradient on the graph going down. At this point virtually all active sites are occupied making the active sites saturated with hydrogen peroxide. With an increase in the concentration of hydrogen peroxide, the number of active sites increases, hence, making a more violent reaction (quicker).
The theoretical maximum rate of the reaction is when all the sites are being used but in reality this theoretical maximum is never reached due to the fact that not all active sites are being used at the same time. The substrate molecules need time to join onto the enzyme and to leave it so the maximum rate achieved is always slightly below the theoretical maximum. The time taken to fit into and leave the active site is the limiting factor in the rate of reaction.
Limitations
To enable this experiment to be completed as accurate as possible, I repeated it three times and then used and then used an average of all the results to best plot a graph with a line of best fit. I tried to keep all the variables, apart from the one I was testing (hydrogen peroxide concentration) the same.
However, unfortunately, in practice it was impossible with this basic apparatus I had to keep all measurements precisely the same. For example:
1. There is a slight delay between pouring the thistle funnel into the beaker of hydrogen peroxide. This will slightly affect all the results for each individual experiment but as I carried out all the steps in the same way, it should not make any negotiable difference to the overall result.
2. It is also impossible to precisely measure out the amounts of hydrogen peroxide and distilled water each time. As the scale on the measuring cylinder shows the measurement to the nearest 1mm3, the solutions that I used should be correct to the nearest mm3.
Criticisms & ways to improve experiment.
I used catalase found in potatoes, which made amount was hard to measure, however, measuring the amount of potato wasn´t difficult. However, that piece could contain different amounts of catalase compared to another piece. The results from both pieces would be negotiable.
Maybe having a source of catalase from yeast would have been much easier to use and handle. Specific amounts could be measured much more precisely.