In order to control this variable, the temperature will be maintained at a constant level of 23 degrees centigrade (room temperature) for the enzyme to function effectively. A test tube rack and tongs will be used to hold the apparatus to prevent the equipment from conducting heat from my hands.
When there is an excess of enzyme molecules, an increase in the substrate concentration will result in an increase in the rate of reaction. To control the substrate (hydrogen peroxide) concentration the same quantities of substrate will be used for each test, 5ml syringes will accurately measure the amount required.
When excess substrate is present, an increase in enzyme concentration will result in an increase in the rate of reaction. However, where the substrate is a limiting factor in the reaction an increase in enzyme concentration will have no effect on the rate of reaction.
To keep the enzyme concentration at a constant level, the potato discs will be cut to the same measurements and each will be weighed to ensure a similar mass before they are used in the experiment.
By keeping the variables constant a fair test should be conducted, resulting in accurate, useful results.
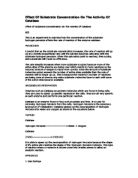
The independent variable in this experiment will be the buffer solutions. A buffer solution is used to maintain the pH level throughout the reaction to ensure a fair test. In this experiment, the pHs of the buffer solutions will be varied, as shown in the concentrations table above.
Experiment Procedure:
- Utilising a cork borer, cut cylinders of potato tuber tissue of about 1cm in diameter and around 6cm in length. Then place a mm configured ruler beside the cylinder. Cut the cylinder into discs 1mm thick. As the discs are cut, submerse them in water in the Petri dish. At least 60 discs are required.
-
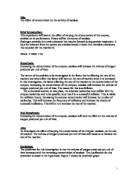
For measuring the rate of oxygen production, use the technique shown in the diagram below. First assemble the apparatus. Remove the rubber bung from the neck of the boiling tube. With a syringe, place into the boiling tube 5cm3 of buffer solution at the chosen pH. Carefully add five potato discs. Then with another syringe, add 5cm3 of hydrogen peroxide to the boiling tube.
- As soon as the hydrogen peroxide is added, replace the bung in the boiling tube and ensure that an airtight seal is formed.
- As the reaction begins and oxygen is produced the manometer fluid should be pushed down the left hand side of the manometer tube. Using the stop clock, time how long it takes for the fluid to rise through a distance of 5cm in the right hand side of the tube. During this period gently agitate the boiling tube to ensure that the reaction is occurring at an optimal level.
- Open the clip at the top of the boiling tube so that the manometer fluid returns to its idle position. Time the evolution of oxygen twice more and work out an average result.
- Remove the bung and wash out the boiling tube thoroughly.
- Repeat steps 1-6 another five times, with a fresh set of five potato discs each time and using differing buffer solutions of the chosen pH in turn.
- For each of the final readings, divide the rate of reaction by 100 by the time taken in seconds for a 5cm rise in the right-hand manometer tube. This provides larger numbers for graph plotting.
- Collate the results in a table
- Plot a graph of the rate of reaction against pH for the results found.
Setup:
Results Table
Results of the experiment are displayed as follows:
Average Times:
Average times were calculated by the addition of the three times for each pH; the total times were then divided by three to provide the average time for the reaction.
Rate of Reaction:
The rate of reaction for the experiment was calculated by using two formulae:
A = π R² and Rate of Reaction = Volume
Time
So, Gas Produced = 3.14 x 1.5² this provides the surface area of the 5cm³ cylindrical space in the manometer tube that the oxygen filled up. Therefore SA = 7.065mm². So, 7.065mm² x 50mm will provide the volume of the 5cm³ space in the manometer tube, which is 353.25mm³.
The rate of reaction can now be calculated as: Rate of Reaction = Volume
Time
The results for the rate of reaction are displayed as follows:
Average Time Results Graph:
Rate of Reaction Results Graph:
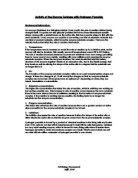
Conclusion:
From the average time and rate of reaction results, it can clearly be seen that the fastest and shortest reaction time was for the pH of 6.3. Basically, this shows that the most appropriate pH for the enzyme Catalase to function in is a pH of 6.3 as it the enzyme is forming a complex with the substrate and producing the by-products H²O and O², at a faster rate.
The least effective pH buffer to use in a Catalase reaction would be a pH of 2.8, although there may be more inhibiting pHs outside the range used in the experiment. The longest reaction was for the pH 2.8 and the smallest rate of reaction was also, therefore pH 2.8.
Moving up the pH range used in the experiment, the rate of reaction continues to increase until the optimal point of pH 6.3, where the rate of reaction slows and average time taken begins to increase above this point, as shown in the pH 8.3 results and graph.
Evaluation:
Overall, the experiment was conducted in a suitable way that enabled the collection of relatively reliable results; however as with most experiments there were some sources of error in its conduction that will have had an effect on the results.
The main error in this experiment was the factor of human error; this was mainly present in the measuring and timing stages of the experiment. The measurement of the buffer solutions, hydrogen peroxide and cutting of potato discs will have had slight discrepancies in their quantities; this will have had a small effect on the results as the enzyme and substrate amounts will have varied and the rate at which products are formed will have increased or decreased.
To eliminate human error in the experiment the measurements and timing would have to be done by using more technological equipment, in order to gain precise results.
Another factor that will have influenced results is the presence of inhibitors when the reaction took place; these occur naturally and can be either competitive or non-competitive:
A competitive inhibitor molecule has a similar structure to the normal substrate molecule, and it can fit into the active site of the enzyme. It therefore competes with the substrate for the active site, so the reaction is slower.
A non-competitive inhibitor molecule is quite different in structure from the substrate molecule and does not fit into the active site. It binds to another part of the enzyme molecule, changing the shape of the whole enzyme, including the active site, so that it can no longer bind substrate molecules. Non-competitive inhibitors therefore simply reduce the amount of active enzyme; similar to decreasing the enzyme concentration.
In conclusion, the presence of these inhibitors will have altered the reaction by increasing or decreasing the rate at which the products are produced.
There will have been limitations in the results as the range of buffer solution pHs used in the experiment were inadequate to determine an exact optimal pH for the enzyme Catalase to function.
To find the optimal pH, further tests could have been conducted by using pHs with closer intervals within the range of 4.5 and 6.5, where the rate of reaction increases sharply, as shown on the graph by an arrow.
By analysing the results and the graphs that were produced, there are no obvious anomalies in the results achieved; however there may have been a slight discrepancy in one result which is marked on the graph/s with a circle. This could have been a consequence of any of the factors mentioned above in the evaluation section.