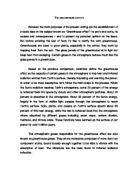
B) The graph’s pattern is all about increasing. Although there are two slight differences in the gradient of the graph in the period of 1850 to 1890 and 1891 to 1970, the graph main pattern is increasing with a rising rate with the increasing number of years. There is no stopping or decreasing period thorough out the graph.
C) The graph is quite random for two times. At first, the graph’s trends were about increasing but suddenly, in 1900 the temperature drop by 0.05 degree Celsius. From the year of 1910, the graph gradient was getting steeper and steeper. Upon reaching 1930, the gradient of the graph become gentle a little bit. Similar to the drop in temperature in 1910, the year of 19140 marks the beginning of a decreasing temperature for the next 30 years. The decrease led a drop in 0.5 degree Celsius, much larger than the 0.05 degree Celsius drop. However, the temperature start picking up again in 1970.This time, the gradient is the sharpest of the entire gradient that is expressed in the graph. The graph reached its second climax and starts to lower its gradient. In the last 30 years, the temperature is increasing still but in a slower rate.
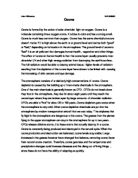
2. For both of the graphs, my predictions went true although there is changes in the actual graph that take place. Firstly, there are decreases in a graph which I did not mention such. In the temperature graph, the fact that causes the decrease was the position of the Earth toward the Sun. There are certain times when the Sun did not give its full light energy to reach the Earth thus less light energy is converted into heat energy. Less heat energy means a colder Earth! That is why the decreases do exist in such graph. Another thing was about the rate of increases or the gradient of the graph. All of the three graphs have different rate or gradient makes one graph look totally distinctive toward another, for example, the graph of 1.4 and 1.2.These two graphs differ from each other in the few first years of the graph (1880-1910).This is probably due to the content of the graph. The first one is about Co2 produced by combustion method which was only introduced and widely used in 1910, the time of the Industrial Revolution that took place in Europe and America. Therefore the amount of Co2 produced from burning fossil fuel will increase due the machinery that uses the energy produced through combustion double their number in the time. On the other hand, the Co2 level is already high in the beginning year 1880.This is due to the various sources that produce Co2, not just combustion. There are volcano, the sea, cellular respiration, declining number of trees that contribute to the sharp rising of Co2 level in the atmosphere.
EXTENSION
- The date evidently shows that the world temperature is increased due to the increase in carbon dioxide concentration. The fact that carbon dioxide increase the world temperature is true .It is because whenever the gas is passed off, as a reaction, as a waste, through cellular respiration, from under the sea, it accumulates in the upper part of the atmosphere. It caused the atmosphere to get heavier. Thus enable it to trap more heat energy, which is converted from the Sun light that enter the Earth. That is why the world temperature increasing rate parallels with the carbon dioxide concentration. Not just the carbon dioxide that makes our Earth hotter, but also other type of gases as well. Methane and Nitrous oxide (laughing gas) only stand second and third to carbon dioxide. These two gases can be even more dangerous because these gases are more reactive than carbon dioxide, carrying little or no activity. Thus more reactive gas can make our atmosphere become a bigger mess which traps heat with greater capacity.
- A) The amount of carbon dioxide produced by combustion should be somewhere near 6.0.10^9 t
B) The atmospheric carbon dioxide concentration should be 360 ppm by 2000
C) The temperature increase compared with 1880 should be 0.6 degree Celsius.
The assumptions here could be that the Earth position should be such that the Earth atmosphere will be able to receive the most of the Sun light. Another assumption is that there is no sudden change the carbon dioxide emission from the ground. The first assumption is there because of the fact that the Earth position matters. Certain position gives the Earth a cooler temperature and different position does the opposite things. The second assumption is mainly made due to the fact that the human world is ever-changing and there are no one can predict what might happen next. Thus, the carbon dioxide emission rate is not fixed according to the timeline. These reasons made the assumptions valid.
- There are various sources that produce carbon dioxide beside combustion from fossil fuels. These are volcanoes , gas passes off from animals, natural reaction under the sea, carbonated drinks releasing carbonate dioxide.That is probably the most sources that produce carbon dioxide.