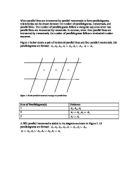
A B C D E F
This would give us 21 parallelograms: A, B, C, D, E, F, A U B, B U C, C U D, D U E, E U F, A U B U C, B U C U D, C U D U E, D U E U F, A U B U C U D, B U C U D U E, C U D U E U F, A U B U C U D U E, B U C U D U E U F, A U B U C U D U E U F.
After doing this, we can say that:
By using the computer program Autograph we are able to illustrate the existing relation between # transversal lines (x) and # of parallelograms (y) by entering the data in the table and obtaining a graph:
As we can see, as we increase the # of transversal lines the # of parallelograms increases exponentially.
This also allows us to develop a general statement:
- We take the first three rows of the table and analyze them.
- The pattern starts at 0 and shows that the # of parallelograms for certain # of transversal lines is the cumulative sum of the # of transversal lines before it. (e.g. If # of transversal lines is 4, # of parallelograms is 1 + 2 + 3 = 6)
- Once this is understood, we try to convert the # of transversal lines into the # of parallelograms with a simple expression. Starting with 1, the initial expression is p = n (n-1), where ‘n’ is the # of transversal lines and ‘p’ the # of parallelograms.
- Test the previous expression with the other values for # of transversal lines. We notice than 2 does not follow the rule, since 2 (2-1) = 2. Consequently, we alter the expression to fit the correct value. The simplest way to do this is the expression p = (n (n-1))/2.
- After making sure that the expression is still true to previous values, we test with the next ones.
- We then discover that the expression is true for all present values of n. Thus, the general formula is:
p = n (n-1)
2
Now let’s see what happens when we repeat the process but we add one more intersecting horizontal line to the basic arrangement
2 lines
A
B
We now have 3 parallelograms when there are 2 lines: A, B, and A U B.
We can repeat this process like last time.
3 lines
A B
C D
This would give us 9 parallelograms: A, B, C, D, A U B, C U D, A U C, B U D, and A U B U C U D.
4 lines
A B C
D E F
This would give us 18 parallelograms: A, B, C, D, E, F, A U B, B U C, D U E, E U F, A U D, B U E, C U F, A U B U C, D U E U F, A U B U D U E, B U C U E U F, A U B U C U D U E U F.
After doing, this we can say that:
We can also develop a general statement from these values:
- We analyze the first three values.
- We notice that the # of parallelograms is three times as many for each value as # of parallelograms from having only 2 intersecting horizontal lines.
- Thus, the general expression is simply:
p = 3 (n (n-1))
2
After all this we see another pattern unfolding, this being the relation between the # of parallelograms as we increase the # of horizontal lines. For example, let us observe the following table:
By extending the results and using Autograph to produce a graph we obtain:
Where the x-axis represents the # of transversal lines and the y-axis represents the # of parallelograms. Each line represents the trend when a certain # of horizontal lines is present, with the # color coded next to it.
By selecting the line and using the Display Information tool of the program, we can see the equation that defines each line.
We then notice that the equations present a pattern since they are being multiplied by an increasing amount (let us call it ‘k’), every time a horizontal line is added. The general expression for this is thus:
p = kn2-kn
This allows us to find k by using Autograph again with the following data:
Where the x-axis represents the # of horizontal lines and the y-axis represents k.
By using the Display Information tool we find that the equation that defines this trend is:
y=0.25x²-0.25x
Thus, k = 0.25m2-0.25m
Now we simply replace k in our last expression and we obtain the general formula for any n transversal lines or m horizontal lines:
P = m (m-1) n (n-1)
2 2
We can test the validity of this statement by trying to arrive to the same expression without the use of technology and simply using mathematical reasoning. Let us look at the table again:
We can see then that the value shown for 2 transversal lines when there are 3 intersecting horizontal lines is 3 times what it was when they were only intersected by 2 horizontal lines. Similarly, when intersected by 4 horizontal lines the value is 6 times what it was, and so on.
From this we can get yet another general expression:
- First we notice that the multiplication factor increases in a series very similar to the series that occurs when there are 2 intersecting horizontal lines. This series is 0, 1, 3, 6…
- Thus the expression for this sequence is the same: (n (n-1))/2
- Since we had already identified how the addition of intersecting horizontal lines affects the # of parallelograms, we understand that its basically the multiplication of the value obtained through the expression (n (n-1))/2 by a value obtained through the same expression but considering the value of the # of horizontal lines, ‘m’: (m (m-1))/2.
- Thus, the general statement becomes:
P = m (m-1) n (n-1)
2 2
Evaluation:
The general statement was tested with all the previously seen combinations of intersecting transversal and horizontal lines and it provided the correct answer for each one of them. For this experiment, this is enough to validate the statement as it is far too time consuming to simply sketch a diagram when, for example, there are 300 intersecting horizontal and transversal lines.
The program Autograph was used to illustrate the relation between two or more variables through graphs. It also provided a means of easily obtaining the equation of a trend in the form of the Display Information tool. This was crucial when validating the results.
Conclusion:
The general statement can be used in almost any situation since ‘n’ is a value decided by the individual, in the sense that when asking “how many parallelograms are there when there are m horizontal parallel lines and n transversal parallel lines” the ‘m’ and ‘n’ values act as independent variables while the # of parallelograms is dependant.
However, it cannot be reversed (such as if given only the # of parallelograms and told to find the values of m and n) since there are two variables and none of them cancels out.
This investigation was carried out by analyzing three different variables and trying to understand the mathematical relationship between them. The statement was found after first observing the effect of an increase in the # of parallel transversal lines on the number of enclosed parallelograms and then doing the same for the # of horizontal lines. Finally, an analysis on the effects of the # of one type of line on the other helped to develop an equation that included them both.