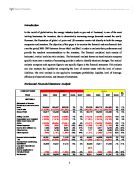
Table 1.2 Vertical Analyses (Income Statement and Balance Sheet)
The next step is to applied vertical analysis. It can be seen from table 1.2(Section A) that the average cost of sale of Shell was higher than Exxon with the value being 65% and 58% respectively, which affected the gross profits of both companies. Moreover, Shell’s capital is mainly financed by debt at approximately 53%, where as the debt for Exxon was around 48%(See in table 1.2, section B) so it means that Shell was responsible for higher interest expense proportion. However, proportion of income tax for Exxon was slightly higher than Shell, with this reason, Exxon’s percentage of net income was still higher than Shell’s, with 10% over the period 2005-2007 comparing to Shell's at 7% averagely.
Another way of expressing relationships between the accounting numbers and their trends over time that can use to measure profitability and evaluate risk is ratio analysis. In this case, the ratios will be categorized into 5 parts: Performance ratios, liquidity ratios, lending or gearing ratios, efficiency ratios, and investor ratios. (See the comparative table form Appendix 1)
Ratio Analysis for Exxon
The company's profitability is quite high equal to gross profit rate at 41% and net income ratio at 18% averagely during 2005-2007. The gross profit ratio is increased by 3% in year 2006 cause of the cost efficiency which actually remains the same level of 2005 while the revenue is increased. But in 2007, the Company's profitability is slightly slowing down by 3% due to the impact of incremental cost of sale about 9% in 2007 whereas revenue is growing only 7%. With the same reason, the net income ratio is increased by 12% in 2006, but it is dropped down by 2% in 2007. (See cost of sale in table 1.1, Section A)
Additionally, measuring the Company's performance by return on capital employed (ROE) and return on assets (ROA) also shows the excellent return for the period of 2005-2007 at average 23% and 18%, respectively. The return is slightly increased in 2006 before dropped down in 2007. ROE is increased by 5% in year 2006 then dropped down 5% in year 2006. ROA is increased by 4% and decreased by 7% in 2006. The main factor is from higher capital employed amount, the business growth and longer receivable and creditor term which they can cause in higher amount of assets in 2007.
This diagram is showing the liquidity ratio to see the capability in paying short-term liability, which concerned in area of current ratio and quick ratio. From the financial theory the good current ratio should be from 1.5 but not over 2.0. In this 3 years period, the overall of liquidity ratios is slightly decreased year by year, but the average current ratio during 3 years in this company is 1.5,
that mean the company shows proper liquidity therefore the ExxonMobil is able to pay its current liabilities. Also it shows that the company is using efficiently its resources that could generate maximum profit. Where as the quick ratio should not be below than 1.00 otherwise the company will facing problem in liquidity. However, quick ratio during 2005-2007 is decreasing by 4% constantly. With all three analyzed years we can observed steady increase of current assets (3% in2006 and 13% in 2007) as well as current liabilities ( 5% in 2006 and 19% in 2007).
.
This graph shows the increase gradually from 47% in 2005 to 50% in 2007, it means 3% increased in 2006 and 4% increased in 2007, which is in range of reccoment between 40% - 50%. The value of total assets from 2006-2007 increased slightly strong(11%). The long term financing increased in both year (11% in 2006 and 10% in 2007) but short term financing increased slightly high in 2007 by 19%.
As you can see from the graph, the receivable day is slightly increased in 2006 but go up 5 days in 2007 due to increasing in receivables by 26% in year 2007. Anyway the average time of receivable day is about one month where as the average time of creditor day is two months. The long period of creditor has quite short time to pay its debts which very good in term of accounting way so they can possibly gain the benefit from other investment from those proceeds If you look at the inventory turnover, it rose up one day in 2006 and remain steady in 2007.The sale increasing 2%in 2006 and 7% in 2007,the trade receivables increasing as well through 2005-2007.
The Company has earning per share steadily every year since 2005-2007. It is illustrated from the graph that the company pay money back to the investor is dramatically rose up during 3 years same as the EPS of this company, which increasing 16% in 2006 and 10% in 2007. In the same way, the dividend per share was increase 12% in 2006 and 7% in 2007. It has been shown that the company performs quite well in term of both for shareholder and company side.
Ratio Analysis for Shell
From the graph above you can see that the gross profit for Shell is steadily declined during year 2005 – 2007 due to the cost of sale raised up at 13%. There was a slight dip in net income ratio, as can be seen from the table net in come in year 2005 and 2007 is remain the same at 12%,but it dipped at 11% in 2006.
Moreover, Return on capital employed (ROE) and Return on assets (ROA) is also dropped down at the middle of examine period. It was an effect from net profit its slightly increased by 1% in 2006 but increased steeply at 23% in 2007.
The diagram illustrates that the current ratios is gradual rise during the three years, where as the quick ratio is slightly decrease by 3% in 2006 before remain steady at 0.89 in 2007. Both value of current ratios and quick ratio is below the recommendation range from the financial theory, this was due to decreasing of current asset by 10% where as the current liability was increased at 1%.
The graph present the percentage of debt ratios in year 2006 decreased by 8% but increase 4% in 2007. It was due to the total liability drop by 1% in 2006 and increased 19% in 2007 where as the total asset increaed 7% in 2006 and 15% in 2007, that mean the company prefer to use debt financing.This due to drop down in current liability in 2006 by 10% befor steeply go up at 23% in 2007. This is related with the higher liabilities amount in each year which is mainly affected from creditor and long tem liabilities
As shown in graph above, the receivable day and creditor day is drop down in 2006 and go up slightly in 2007. (6 days increased) due to increasing in receivable by 24% in year 2007 to focus in this ratio is to look at the average time of receivable and average creditor day. Even though the average receivable day is high at 60 days, but the average creditor day is higher at 90 days. It illustrated that the company can. The long period of creditor day is preferred in accounting way if the company can collect money earlier is mean the better performance. On the other hand, you can see that the inventory turn over is rose up year by year because of the impact from the trade receivables rose up in 2006 and 2007 accordingly.
It was illustrated from the graph that the company pay money back to the investor ( Earnings per share is slightly increased in 2006 then rocketed from 3.97 to 5.00 in 2007. As the Diluted EPS of this company increasing 5% in 2006 before dramatically rose up by 26% in 2007. In the same way, the dividend per share was increase 12% in 2006 and 7% in 2007. It has shown that the company had good performance in the business.
Comparison Ratios Analysis
From the graph above illustrates that the AVG gross profit ratio of Exxon is better than the AVG gross profit ratio of Shell over the analysis period although it was slightly drops in 2007. However, the higher cost of sale in each year is impacted the profitability ratios but the overall Exxon’s profitability ratios is better than Shell.
This graph illustrated that the current ratio and quick ratio of Exxon is higher than Shell and the value is in range between 1.5 – 2.0, so that you can see the current ratio in Shell is below 1.5. had a problem in liquidity comparing with Exxon although the quick ratio of Exxon is not good as Shell. This was due to the inventory changed.
This graph is giving you an idea in financing relationship about Debt ratio, related with total liability and total assets. The debt ratio of Shell is higher than Exxon, which mean that Shell is facing in risk rather than Exxon, which had a better performance in debt ratio due to the lower of debt.
The graph above is comparing the efficiency ratios between Exxon and Shell. The spotlight of this ratio is mainly seeing the receivable. The efficiency ratio of Shell is higher than Exxon due to the higher in receivable. However, Exxon has a good performance than Shell because the shorter is the best and average receivable can be collected earlier than when the company has to pay for creditors. Also, inventory day is shorter, it can be show that the company needs to keep higher inventory to save cost of inventory.
As can be seen from the chart, that the dividend per share is slightly different, but the EPS of Exxon is better. It is showing that Exxon has a well again in inventors ratio although
Shell has a net income per share rose up dramatically higher than Exxon in 2007.
Recommendation
With the use of calculated horizontal, vertical and ratio analysis with careful and detail interpretation of the companies policies and financial statements of Exxon and Shell during 2005-2007. I would recommend 2 options to the investors.
-
For long term investment: I recommend Exxon for the investors rather than Shell because the revenue and investors ratio increased gradually year by year same as the dividend per share even though the percentage increased of those ratios were not as high as Shell during the year 2007. Moreover, the value of net income per share keep going up before hit a peak value at 7.36 in 2007 which was much higher that the shell’s value. Furthermore, Exxon has significantly lower gearing ratio than Shell which illustrates that the company is stable and has good financial security which can be concluded as good long term investment for investors. With regard to the number of dividend per share, due to high earning per share value, it is financial viable for the company to increase the dividend for shareholders but from the existing trend, it is unlikely that the dividend per share will be increased anytime soon. Also it is hard for Shell to keep increasing its dividend per share value for long period of time.
-
For short term investment: I recommend Shell for the investors if comparing with Exxon. As you can see from the financial statement in table 1.1 (or Appendix 1.) Even though the liability in Shell increased dramatically, but the interest expenses were decreased over the year with the revenue went up by 11% in 2007. This could be interpreted as, Shell asking for more loan to invest in the products rather than using its own profit that was why revenue in Shell increased from 3% in 2006 to 11% in 2007, this may affect to net income per share, which rose up as steep as 26% in 2007. Moreover, the dividend per share of Shell is higher than Exxon which means that the current policy for Shell is to maintain high value of dividend per share (45% of net profit in year 2007) therefore the dividend per share might be in this direction during the next 2-3 years which can be sum up as good profit for investors in short term period.
However, before making a final decision it is considerate to include the concept of “High risk high return” and “Low risk low return” and also focusing more on the strategy of each company.
Performance analysis and ratio analysis can be used to assist many groups of stakeholders including potential investors. However, ratio analysis has many limitations which prevent stakeholders from concluding a complete analysis of a company or between companies. Those limitations are presented as follow:
As ratios are calculated from information provided by the chosen company, they correctness of the ratios are directly depend on the quality and the availability of the financial data. Therefore, if the data has been calculated inaccurately then the responding financial ratios would not be the correct representative of the company. Moreover, ratio analysis uses historical data in calculations, which means that resultant ratios are not necessary reflect the future financial performance of trend of the company. Furthermore, ratio analysis uses data from financial statements including balance-sheet figures which are reviews of the records in that financial year which does not represent financial situation at another time of year. The companies also might not have the same accounting period which can lead to variation in financial data and therefore cause difficulty in comparing.
The different in accounting policies also poses difficulty to analyser, this is due to the fact that companies may have been used their own accounting methods and it is extremely difficult to judge by just looking at the balance sheet or income statement. Moreover, some company may want to apply creative accounting to present better financial performance which can lead to misunderstanding when comparing with other company. In the case of Exxon and Shell, the financial data provided cannot be compared directly as Shell’s revenue has already deducted tax payment while Exxon has not. It was crucial to modify the data before carrying out the ratio analysis.
Another limitation involves inflation levels, as ratios are obtained from analysing financial statements over a number of years, the inflation levels may be the cause of changes in financial data, instead of the company financial performance which can lead to incorrect interpretation of the company performance. Therefore inflation should be adjusted in the active periods.
With regard to comparison between companies, even though both Exxon and Shell are in the same industry, using only ratio analysis to compare the two companies’ financial positions could lead to wrong interpretation. It is of high interest to any analyser to obtain and analyse as much information on the risk of each companies as possible prior to making any decision. For example, the data given by Exxon and Shell do not include their interest rates, it makes sense for a company to acquire more bank loan if the company can achieve low interest rate. However, high amount of bank loans create liability that lead to high gearing ratio which is not necessary bad for the company.
Despite these limitations, ratio analysis is still a good way to give stakeholders the insight of a company financial performance. However, analysers shouldn’t ignore the limitations and careful judgement is highly required.
Appendix 1
Comparative Financial Information
Appendix 2
Ratios presented in tables for Exxon
Appendix 3
Ratios presented in tables for Shell
Appendix 4
Ratios comparison of Exxon and Shell presented in tables
Appendix 5
Formulas
Assets = Liabilities + Equity
Revenue = Turnover – Expenditure
Cost of Sale = Opening Stock + Purchase – Closing Stock
Gross Profit = Sales – Cost of Sale
Net Profit = Gross Profit – Various Expenses
Gross Profit Ratio = Gross Profit x 100%
Revenue
Net Profit Ratio = Net Profit x 100%
Sales
Net Income Ratio = NPBIT x 100%
Revenue
(NPBIT = Net Profit before interest and tax)
Return on Capital Employed (ROE) = Net Profit x 100%
CAPITAL EMPLOYED
(CAPITAL EMPLOYED = Total Equity + Long term Liability)
Return on Assets (ROA) = Net Profit x 100%
Total Asset
Current Ratio = Current Assets
Current Liabilities
Quick Ratio = (Current Assets – Inventories)
Current Liabilities
Debt Ratio = Total Liabilities
Assets
Receivable Days = Trade Receivables x 365
Sales
Creditor Days = Trade Creditors x 365
Cost of Sales
Inventory Turnover = Average Inventory x 365
Cost of Sales
Earnings per share = Net Profit after tax and pref dividend
No. of ordinary shares
Dividend per share = Dividend
No. of ordinary shares
Dividend cover = Earning per share
Dividend per share
Price/Earning Ratio = Market price per share
Earning per share
Reference List:
- Financial Ratio Tutorial from
- Financial Statement on line from
- Limitations of Ratio analysis from
- Alexander D., 2005 International Financial Reporting and Analysis
-