Power Distance Index (PDI) focuses on the degree of equality, or inequality, between people in the country's society. Its suggests the level of a cultures inequality is endorsed not only by the leaders or the people above but by the people below as well. All societies contain power and inequalities but each has different levels of them. A High Power Distance ranking indicates that inequalities of power and wealth have been allowed to grow within the society. These societies are less likely to allow significant upward mobility of its citizens. A Low Power Distance ranking indicates the society de-emphasizes the differences between citizen's power and wealth. In these societies equality and opportunity for everyone is stressed.
Individualism (IDV) focuses on the degree the society reinforces individual or collective, achievement and interpersonal relationships. The opposite of individualism is collectivism. A High Individualism ranking indicates that individuality and individual rights are paramount within the society. Individuals in these societies may tend to form a larger number of looser relationships. In effect this means that an individual should look after themselves and their close family because no one else will. A Low Individualism ranking or collectivism typifies societies with close ties between individuals. These cultures reinforce extended families and collectives where everyone takes responsibility for fellow members of their group.
Masculinity (MAS) focuses on the degree the society reinforces, or does not reinforce (feminism), the traditional masculine work role model of male achievement, control, and power. A High Masculinity ranking indicates the country experiences a high degree of gender differentiation. In these cultures, males dominate a significant portion of the society and power structure, with females being controlled by male domination. A Low Masculinity ranking indicates the country has a low level of differentiation and discrimination between genders. In these cultures, females are treated equally to males in all aspects of the society.
Uncertainty Avoidance Index (UAI) focuses on the level of tolerance for uncertainty and ambiguity within the society. It illustrates how comfortable or uncomfortable members of a society fee in unstructured situations. Unstructered situations are any situation that might be different from usual or unknown. A High Uncertainty Avoidance ranking indicates the country has a low tolerance for uncertainty and ambiguity and tries to reduce the possibility of such situations arising. To achieve this a society will create laws, rules, regulations, and controls in order to reduce the amount of uncertainty. On a religious level they are more likely to focus on one true religion only. A Low Uncertainty Avoidance ranking indicates the country has less concern about ambiguity and uncertainty and has more tolerance for a variety of opinions. This is reflected in a society that is less rule-oriented, more readily accepts change, and takes more and greater risks. On a religious level there will appear a greater variety of religion flowing side by side. Members of this type of society are likely to be calm, reflective and not express their emotions.
Long-Term Orientation (LTO) focuses on the degree the society embraces, or does not embrace long-term devotion to traditional, forward thinking values. This dimension is based on the teachings of Confucius, an extremely influential Chinese philosopher who lived around 500 B.C. High Long-Term Orientation ranking indicates the country prescribes to the values of long-term commitments and respect for tradition. This is thought to support a strong work ethic where long-term rewards are expected as a result of today's hard work. However, business may take longer to develop in this society, particularly for an "outsider". A Low Long-Term Orientation ranking indicates the country does not reinforce the concept of long-term, traditional orientation. In this culture, change can occur more rapidly as long-term traditions and commitments do not become impediments to change.
We will now examine the value scores for the countries relevant to this report, England and Spain and how these values affect may affect an international business relationship.
1.1.2 Hofstede’s results for the United Kingdom
Table 1: Hofstede’s Cultural Value results for the United Kingdom
Source: Hofstede (2000)
Graph 1: Cultural Value results for the United Kingdom
Source:
Hofstedes Cultural value results for the United Kingdom (table 1, graph 1) show a high individualism ranking and an average above the world ranking for masculinity (graph 2). The UK also shows values of; a low power distance, low uncertainty avoidance and a low long term orientation.
Graph 2: World average value scores for Hofstede’s dimensions
Source:
Hofstede has also proven a correlation between a countries religion and its culture. In the United Kingdom almost 80 % of the population practice some form of Christianity, other than Catholicism. Hofstede has shown a trend that predominantly Christian countries (over 50%) as show characteristics of high Individualism.
1.1.3 Hofstede’s results for Spain
Table 2: Hofstede’s Cultural Value results for Spain
Source: Hofstede (2000)
Graph 3: Cultural Value results for Spain
Source:
Hofsetede’s results (table 2, graph 3) indicate a high uncertainty avoidance ranking and a low masculinity ranking. The other indicators PDI and IDV are fairly average compared with the rest of Europe (graph 4).
Graph 4: Cultural value results for European Countries
Source:
Hofstede has found that when a country is largely of the Catholic religion there tends to be a correlation between this and a high UAI which from graph 3 we can see is true for Spain.
1.1.4 A comparison of the dimensions between the United Kingdom and Spain
Graph 5: A comparison of scores from the United Kingdom and Spain
Source:
Graph 5 compares the dimensions between the UK and Spain and we can see some significant differences. Spain has a higher power distance than the UK. This signifies that in Spain power and wealth is distributed unequally. It suggests a larger gap between managers and employees than in the UK. It is reasonable to propose therefore that UK managers dealing with a Spanish business might find this difference unsettling and potentially confusing. The UK has a higher individuality ranking than Spain which is slightly collectivist. A Spanish person may find the UK’s lack of team players in the work place highly inappropriate, especially given the high UAI for Spain. In fact UAI could be the most important difference, the Spanish index being high and the UK’s low. This combination of opposites could make a business arrangement particularly difficult to reach a satisfactory outcome. The Spanish partner would expect a structured and familiar approach and might find the unemotional attitude of the UK to be cold and unfriendly.
The UK has a high Masculinity index compared with a more feminine index from Spain. The low index for Spain can be attributed to the importance of women in society, however they are still not recognised as equal in business. It is possible therefore that a Spanish male manager might not deal well with a female from the UK in the same position of power as him or higher.
There is not a LTO index for Spain as this dimension is relatively new in Hofstede’s work.
1.1.3 Critique of theory
Hofstede has been heavily criticised over the years, these criticisms are well documented, Hofstede (2001:73) himself lists the usual faults people find with his work. Among those is included a prominent criticism that results gathered from only IBM employees cannot show the true national culture of a society. IBM employees might have a culture within the national culture that differs. Hofstede argues that “any set of functionally equivalent samples from national populations can supply information about cultural differences” (Hofstede 2001:73).
Hofstede’s work is based on certain assumptions, McSweeney (2000) argues that these assumptions are, “fundamentally flawed,” and “therefore his national cultural descriptions are invalid and misleading.” The first of these assumptions is that “every micro-location is typical of the national.” McSweeney argues that there is no evidence that employees in IBM subsidiaries are representative of national cultures. He believes it is absurd to make generalisations about national cultures based only on a small number of questionnaire responses.
The use of questionnaires is not deemed a suitable measure for cultural differences. Hofstede agrees that these should not be the only measure. The main problem with the questionnaires is that the questions are restrictive for the respondent. A spoken interview would achieve more and produce more in depth and insightful responses.
Many academics also wonder at the usefulness of the results now given the age of the data, “the fact that Hofstede’s data were gathered some 30 years ago and apply to a world that no longer exists seems to be generally ignored,” and further more, “it seems hard to imagine that the work values of 1980 – or rather the late 1970’s when the data was gathered – have not undergone significant shifts owing both to new pressures on individuals to ‘to deliver’ and new possibilities for self-development.” (Holden 2002:34) However Hofstede argues that since then his data has been validated by subsequent replications.
Many also find Hofstede’s work to be limited and that 5 dimensions are not extensive enough. He welcomes anyone to try and create more dimensions.
1.2 Fons Trompenaars and Charles Hampdon-Turner
The studies carried out by Trompenaars and Hampdon-Turner are in some ways similar to Hofstede’s work. They conducted surveys using questionnaires on managers around the world and from the results developed 7 dimensions. These dimensions do not assume that cultures are different but that they are mirror images of one another’s values and they show reversals in the order and sequence of learning and looking. To measure each dimension they presented a dilemma to the respondent therefore forcing them to think hard about the options presented and make a choice. Trompenaars and Hampden-Turner describe these 7 dimensions as follows:
Universalism – Particularism
Universalism can be defined as “rules, codes, laws, and generalizations”, where “universalism searches for sameness and similarity and tries to impose on all members of a class or universe the laws of their commonality.”(Trompenaars and Hampdon-Turner 2000:13, 14)
Particularism is defined as “Exceptions, circumstances and relations” which, “searches for differences, for unique and exceptional forms of distinction that render phenomena incomparable and of matchless quality.” (Trompenaars and Hampdon-Turner 2000:13, 14)
According to their research most universalist countries are protestant with stable democracies like the UK where as catholic countries like Spain tend to be less universalist.
Individualism – communitarianism
Aspects of Individualism are classified as “competition, self-reliance, self-interest and personal growth and fulfilment,” which “seeks to locate the origins of value in the
creative, feeling, inquiring, and discovering person who seeks fulfilment and is solely responsible for choices made and convictions formed.” (Trompenaars and Hampdon-Turner 2000:68, 69)
Communitarianism is defined as “cooperation, social concern, altruism, public service and social legacy,” which “seeks to locate the origins of value within the social discourse of the living society, which nurtures, educates, and takes responsibility for the spirit engendered among its members.” (Trompenaars and Hampdon-Turner 2000:68, 69)
They have illustrated Spain and the UK as countries are fairly individualist.
Achieved – Ascribed Status
This dimension relates to the method success and accomplishments are obtained and which method is more accepted in a society. Achieved status, is status that has been worked for and obtained by an individual’s merit and performance. Ascribed status is status that is obtained by privilege or perhaps connections. Ascribed status could be awarded to people who are perhaps wealthy, attractive or those from esteemed families. The results show that the United Kingdom is split half achieved status and half ascribed status.
Inner – Outer Direction
This division deals with where a society believes virtue comes from. “Inner direction conceives of virtue as inside each of us – in our souls, wills, convictions, principles, and core believes – in the triumph of conscious purpose. Outer direction conceives of virtue as outside each of us in natural rhythms, in the beauties and power of nature, in aesthetic environments and relationships.” (Trompenaars and Hampdon-Turner 2000:234)
Inner direction assumes that the most powerful tool is within us and thoughtful consideration and perceptive approaches are the best way. An outer direction approach uses the outside world as a resource to find information and make decisions.
Specificity – Diffuseness
Specificity describes the small part of a whole with minute attention to detail. It assumes that analysis is the key to success. Diffuseness describes the opposite, it relates to looking at the whole picture in order to reach true understanding. The results show the UK to be relatively Specific while Spain is more Diffuse in its outlook. They also showed that in the UK their exists a lack of group responsibility
Sequential – synchronous Time
Sequential time describes time that is continuous, seconds run to minutes, minutes to days, days to weeks and so on. Synchronous time is circular and events and opportunities repeat themselves.
Equality - Hierarchy
Equality suggests that all people are equal, with equal rights irrespective of birth or wealth. Hierarchy suggests that all people are not equal and that some are superior to others.
1.2.1 Critique of Theory
A lot of the examples Trompenaars used to describe the dimensions are based on ancient history. Interesting though this is one finds it hard to relate their relevance to the subject matter. It makes Hofstede seem positively futuristic in comparison. The data is not easy to use, the dimensions make little sense and in all the theory has little practical use. There was a tendency throughout the book (Trompenaars and Hampdon-turner, 2000) to focus a lot on the United States. The theory had few practical purposes and despite being one of the leading theorists in this field there wasn’t much to help distinguish Spanish and English business culture. However for a manager interested in using their theory in a cross-cultural situation, for a small fee, ‘Trompenaars Hampdon-Turner Intercultural Management Consulting’ may be able to help.
1.3 Nigel Holden
The previous two theories focus on the traditional concept that cross-cultural management is the management of cultural differences. Nigel Holden however believes this view to be restricted, and in his book (Holden 2002) he begins to develop and construct a new way of approaching cross-cultural management from a knowledge management perspective.
Holden is very much “concerned with putting management back into the expression cross-cultural management,” which he defines as, “The core task of cross-cultural management is to facilitate and direct synergistic interaction and learning at interfaces, where knowledge, values and experience are transferred into multicultural domains of implementation.” (Holden 2002:59)
Holden used four detailed company case studies which were; Novo Nordiski (Denmark), Matsushita Electric Industrial Company (Japan), Sulzr Infra (Switzerland) and LEGO (Denmark). Holden investigated and analysed the four informant companies to show their cross-cultural activities from a knowledge management perspective.
It is important to understand Holden’s methodology before attempting to understand his ideas. Knowledge management is concerned with organisational knowledge not scientific knowledge gathered from books. According to Nymark (2000) there are two types of organisational knowledge, the first is the paradigmatic mode the second is the narrative mode. The paradigmatic mode is more suited to large scale surveys while the narrative mode focuses more on the individual. It is the latter mode which Holden utilised to analyse the informant companies. Organisational Knowledge includes areas such as; technologies, practical experience and managers capabilities.
Knowledge management is generally seen to be the key to competitive success. The aim of knowledge management is to promote and encourage the distribution and development of knowledge.
Research was conducted by way of interviews held with managers of different countries and areas for each of the four companies. The managers were encouraged to talk freely and interviews were conducted over a two year period between 1998 and 2000. The interviews were not standardised and questions depended on the research area chosen for each company.
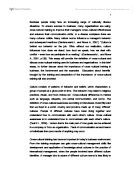
Holden analysed the cross-cultural knowledge management activities of the four companies and used the information to develop a conceptual framework. Diagram 1 illustrates part of this framework.
Interactive translation is described as the process of combining varieties of common knowledge in a company. Common knowledge can either be known throughout the organisation or only by a few. Interactive translation is a task of cross-cultural management. It can also be defined literally as a “practice that involves interlingual translation: the cognitive movement of knowledge, ideas and experience among different languages.” (Holden 2002:228) In an international company, participants of interactive translation work in multicultural groups in order to learn how to work together in that team. They must resolve common meanings and understandings and use participative competence to aid organisational transfer of knowledge, values and experience.
Participative competence is the ability to join in with team work in multicultural group even if using a second language. It is very important to be able to share knowledge and stimulate group learning.
Combating noise relate to constraints faced by a translator on the international transferability of knowledge. One of these constraints is ambiguity which is a problem if there is confusion in the original text. Interference occurs when errors are introduced from one’s own linguistic and cultural background. Lack of equivalence occurs when it is not possible to find an exact matching word in the target language.
Diagram 1: Process model of cross-cultural management and knowledge transfer
Source of Diagram 1: Holden 2002:274
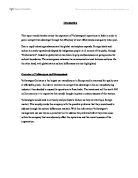
Holden also adds an extension to this model and that is of atmosphere in cross-cultural communication, as illustrated in diagram 2. Atmosphere is an important concept for the manager to understand. It is the ability to “create and sustain a conductive, collaborative atmosphere.” (Holden 2002:275)
Diagram 2: Concentric model of cross-cultural knowledge transfer wit atmosphere at the core
Source: adapted from Holden 2002:277
1.3.1 Critique of Holden’s Work
Unlike Hofstede Hampdon-Turner and Trompenaars academic criticism for Holden is hard to find. The most likely reason for this is that his work is fairly recent and also that his ideas are not as fully developed as the other two theories. Nor does he make concrete large scale claims.
The theory is at its early stages of development and as Holden (2002:284) freely admits, “By developing the notion of culture as an object of Knowledge management, I have attempted to show how culture can be understood as an organizational resource. But I am only to aware of making a few tentative steps and I hope others will take up the intellectual challenge.”
Holden’s conceptual framework like culture is complicated and might not lend itself well to the common manager.
2 Methodology
The aim of the research was to conduct an investigation which would show the differences in culture in the workplace between the United Kingdom and Spain. The results from such a study could be used to aid cross-cultural managers in understanding the values of the two countries.
The method of obtaining the results was the Values Survey Model 1994 which was designed, developed and used by Hofstede in his research. There were several reasons for replicating his research. The first was to assess if any different and interesting results could be obtained. There was sadly never a possibility that the investigation could be bigger or better than Hofstede’s due to the size of the project. However the hope was that any results found could be confirmed and validated by Hofstede’s intensive research.
Other reasons for using Hofstede’s method of research are that quantifying of data is not complicated and therefore lends itself well to the average manager.
A sample size of 50 employees from each country was first chosen but as the investigation began it was clear that this target was going to be difficult to obtain and the sample size was reduced to 31.
The sample in Spain was obtained from employees in a 112 emergency call centre in Murcia. The call centre was chosen primarily for the importance of obtaining the information in one site of research only and by having a contact on the inside. The questionnaire is of course in Spanish. (Appendix 1)
In the United Kingdom the research was conducted on employees of the Lands End Factory in Rutland. This company was chosen for its reputation for openness which proved to be true as the author was given easy access to conduct the investigation.
The Value Survey Model 1994 shown in table 3 shows the array of questions asked. For the purpose of this investigation questions 1-20 are the most important. The purpose of the questionnaire is to collect data which can be quantified to form an index. The index is categorised according to Hofstede’s dimensions which have been previously discussed in the literature survey.
Table 3: Value Surveys Model 1994
Please think of an ideal job, disregarding your present job, if you have one. In choosing an ideal job, how important would it be to you to ... (please circle one answer in each line across):
1 = of utmost importance
2 = very important
3 = of moderate importance
4 = of little importance
5 = of very little or no importance
1. Have sufficient time for your personal or family life 1 2 3 4 5
2. Have good physical working conditions (good ventilation and lighting, adequate work space, etc.) 1 2 3 4 5
3. Have a good working relationship with your direct superior 1 2 3 4 5
4. Have security of employment 1 2 3 4 5
5. Work with people who cooperate well with one another 1 2 3 4 5
6. Be consulted by your direct superior in his/her decisions 1 2 3 4 5
7. Have an opportunity for advancement to higher level jobs 1 2 3 4 5
8. Have an element of variety and adventure in the job 1 2 3 4 5
In your private life, how important is each of the following to you? (please circle one answer in each line across):
9. Personal steadiness and stability 1 2 3 4 5
10. Thrift 1 2 3 4 5
11. Persistence (perseverance) 1 2 3 4 5
12. Respect for tradition 1 2 3 4 5
13. How often do you feel nervous or tense at work?
1. never
2. seldom
3. sometimes
4. usually
5. always
14. How frequently, in your experience, are subordinates afraid to express disagreement with their superiors?
1. very seldom
2. seldom
3. sometimes
4. frequently
5. very frequently
To what extent do you agree or disagree with each of the following statements? (please circle one answer in each line across):
1 = strongly agree
2 = agree
3 = undecided
4 = disagree
5 = strongly disagree
15. Most people can be trusted 1 2 3 4 5
16. One can be a good manager without having precise answers to most questions that subordinates may raise about their work 1 2 3 4 5
17. An organization structure in which certain subordinates have two bosses should be avoided at all costs 1 2 3 4 5
18. Competition between employees usually does more harm than good 1 2 3 4 5
19. A company's or organization's rules should not be broken, not even when the employee thinks it is in the company's best interest 1 2 3 4 5
20. When people have failed in life it is often their own fault 1 2 3 4 5
Some information about yourself (for statistical purposes):
21. Are you:
1. Male
2. Female
22. How old are you?
1. Under 20
2. 20-24
3. 25-29
4. 30-34
5. 35-39
6. 40-49
7. 50-59
8. 60 or over
23. How many years of formal school education (or their equivalent) did you complete (starting with primary school)?
1. 10 years or less
2. 11 years
3. 12 years
4. 13 years
5. 14 years
6. 15 years
7. 16 years
8. 17 years
9. 18 years or over
24. If you have or have had a paid job, what kind of job is it / was it?
1. No paid job (includes full-time students)
2. Unskilled or semi-skilled manual worker
3. Generally trained office worker or secretary
4. Vocationally trained craftsperson, technician, informatician, nurse, artist or equivalent
5. Academically trained professional or equivalent (but not a manager of people)
6. Manager of one or more subordinates (non-managers)
7. Manager of one or more managers
25. What is your nationality?
26. What was your nationality at birth (if different)?
Thank you very much for your cooperation!
Source: http://feweb.uvt.nl/center/hofstede/english.html
3 Analysis
Once the questionnaires have been completed and collected they need to be analysed. Table 4 and Table 5 show the raw results from Spain and from the UK. Questions 1-20 are used to calculate index scores relating to the 4 dimensions of national cultural values illustrated in the literature survey: Power Distance, Individualism, Masculinity and Uncertainty Avoidance.
Table 4: Raw data from 112 call centre in Spain
Table 5: Raw data from Lands End in the United Kingdom
Each of the questions has a 5 option answer, as previously seen in the questionnaire: table 3. An example for how the mean on a 5 point scale for each question was calculated can be shown by demonstrating using the results from table X for responses to the first question:
Mean= (1x14) + (2x7) + (3x4) + (4x5) + (5x1)
31
= 2.1
Once the mean is calculated for each question the index formulas can be used (Hofstede: ) and they are as follows:
Power Distance Index (PDI)
PDI = –35m(03) +35m(06) +25m(14) –20m(17) –20
Where m(03) is the mean score for question 03, etc.
An index value 0 relates to a small Power Distance and 100 a large Power Distance.
Individualism Index (IDV)
IDV = –50m(01) +30m(02) +20m(04) –25m(08) +130
Where m(01) is the mean score for question 01, etc.
The index value 0 means a strongly collectivist country and 100 a strongly
individualist country.
Masculinity Index (MAS)
MAS = +60m(05) –20m(07) +20m(15) –70m(20) +100
Where m(05) is the mean score for question 05, etc.
An index a value of 0 is strongly feminine and 100 is strongly masculine.
Uncertainty Avoidance Index (UAI)
UAI = +25m(13) +20m(16) –50m(18) –15m(19) +120
Where m(13) is the mean score for question 13, etc.
An index value of 0 indicates weak Uncertainty Avoidance and 100 indicates strong
Uncertainty Avoidance.
A full set of calculations for each of the indexes in each country can be seen in Appendix 2. The results are shown in table 6 and Graph 6.
3.1 Index Value results for Spain and the United Kingdom
Table 6: Comparison of Index Value results for Spain and the United Kingdom
Graph 6: Comparison of Index results for Spain and England
Table 6 and Graph 6 present the results of the investigation clearly. The United Kingdom achieves indexes higher than Spain in all of the dimensions except masculinity, where the UK has a negative figure index. According to Hofstede it is possible to produce a negative index.
4 Discussion
General restrictions of the investigation included the difficulties of finding a suitable sample area in each country. The aim was to find a company that had enough employees for a suitable sample size to ensure that all the data was collected in one area. Before the informant companies were selected others were used and data was collected but the sample size was not large enough to produce valid results.
A further restriction to overcome was the possibility that respondents would not answer honestly for fear of the information returning to their employer or could not admit the truth of the answers to themselves. The latter is not easily overcome but the former was overcome by assuring respondents that answers were completely confidential. Further more names were not requested on the survey.
It is clear from the results of the investigation that the data is not entirely validated by Hofstede’s data. (Table 7)
Table 7: A Comparison of the Investigational Data with Hofstede’s Data
There are some similarities between the data. The PDI is very close for the UK and so is the IDV, but that is were the similarities end.
The main reason why the investigation’s results don’t correlate with Hofstede’s results is that although the sample size was above the minimum recommended it still wasn’t large enough. An interesting element of the investigation, is the Masculinity index for Spain which is a lower, more feminine index than Hofstede’s. This is interesting because Hofstede predicted that as women made progress in the work force the index score would lower, and it has.
The investigation is completed and one of the aims was to find which theory could explain business culture in the United Kingdom and in Spain. Undoubtedly Hofstede has contributed the most to this project. His framework is clear and insightful and his methods are easy to follow. Despite the criticisms aimed at Hofstede he remains to hold the largest data bank for inter-cultural comparison.
It appears after investigation that Trompanaars and Hampdon-Turner have little to offer this project in terms of defining Spanish and British business culture. They do however, illustrate a thorough understanding of culture in the US.
Holden’s analysis has perhaps proven to be the most insightful and useful of the three theories. This is because his methodology can be applied to any business going into any country
5 Conclusion
The first aim of this report was to examine the most important theories of culture and analysis there usefulness as an aid to cross-cultural management. The second aim was to highlight the differences of business culture in the UK and Spain utilising the theories. The first aim was relatively more successful than the second.
The three theories discussed were those by Geert Hofstede, Fons Trompenaars and Hampdon-Turner, and Nigel Holden. It has been discussed that despite the criticisms aimed at Hofstede’s work his theories are wide ranging and a useful tool to aid in the analysis of cross-cultural differences. Trompenaars work unless one is willing to pay for his consulting advice is slightly less comprehensive. Holden’s new and novel approach is perhaps by far the best. It supplies common sense and can relate to the most extensive of international businesses.
Utilising the theories to analysis the cultural business differences between the UK and Spain was a useful exercise in testing the theories. This helped to highlight the pros and cons of each framework. Undoubtedly the most helpful of the frameworks was Hofstede’s however again Holden’s ideas could be extremely beneficial.
Appendix 1
Values survey model 1994, Spanish version
Source:
Piense por favor en un trabajo ideal - sin tener en cuenta su trabajo actual, si lo tiene. Al escoger un trabajo ideal, qué grado de importancia tendría para usted...
(marque, por favor, una casilla por línea)
1 = de muchísima importancia
2 = muy importante
3 = de moderada importancia
4 = de poca importancia
5 = de muy poca o nada de importancia
1. Tener suficiente tiempo para su vida personal o familiar 1 2 3 4 5
2. Tener buenas condiciones físicas de trabajo (por ej.): buena ventilación, buena luz, espacio de trabajo adecuado, etc.) 1 2 3 4 5
3. Tener una buena relación con su superior directo 1 2 3 4 5
4. Tener seguridad de trabajo 1 2 3 4 5
5. Trabajar con personas que colaboran bien con las otras 1 2 3 4 5
6. Ser consultado por su superior directo en sus decisiones 1 2 3 4 5
7. Tener la oportunidad para conseguir trabajos de más alto nivel 1 2 3 4 5
8. Tener un elemento de variedad y aventura en el trabajo 1 2 3 4 5
En su vida privada, ¿qué grado de importancia tiene para usted lo siguiente? (marque, por favor, una casilla por línea)
9. Estabilidad personal 1 2 3 4 5
10. Economizar 1 2 3 4 5
11. Persistencia (perseverancia) 1 2 3 4 5
12. Respeto a la tradición 1 2 3 4 5
13.¿Con qué frecuencia se siente nervioso o tenso en el trabajo?
1. nunca
2. raras veces
3. algunas veces
4. a menudo
5. siempre
14.¿Con qué frecuencia, según su experiencia, sienten los subordinados temor a expresar su disconformidad con sus superiores?
1. casi nunca
2. raras veces
3. algunas veces
4. frecuentemente
5. muy frecuentemente
¿En qué medida está de acuerdo o en desacuerdo con las siguientes afirmaciones?
1 = totalmente de acuerdo
2 = de acuerdo
3 = ni de acuerdo ni en desacuerdo
4 = en desacuerdo
5 = totalmente en desacuerdo
15. Se puede confiar en la mayoría de las personas 1 2 3 4 5
16. Se puede ser un buen director sin tener respuestas exactas a la mayoría de las preguntas que los subordinados puedan hacer acerca de su trabajo (de los subordinados) 1 2 3 4 5
17. Se debe evitar a todo coste una estructura de organización en la cual ciertos subordinados
tienen dos jefes 1 2 3 4 5
18. La competencia entre empleados normalmente causa más daño que bien 1 2 3 4 5
19. Las reglas de una organización o compañía no se deberían infringir, incluso cuando el empleado piensa que es por el bien de la compañía 1 2 3 4 5
20. Cuando la gente fracasa en la vida, es a menudo por su propia culpa 1 2 3 4 5
Información personal (por objetivos statísticos):
21. Usted es:
1. hombre
2. mujer
22. Su edad es:
1. Menos de 20
2. 20-24
3. 25-29
4. 30-34
5. 35-39
6. 40-49
7. 50-59
8. 60 o más
23. ¿Cuántos años de educación escolar formal (o su equivalente) ha realizado en total?
1. 10 años o menos
2. 11 años
3. 12 años
4. 13 años
5. 14 años
6. 15 años
7. 16 años
8. 17 años
9. 18 años o más
24. Si tiene o ha tenido un trabajo remunerado, ¿de qué tipo de trabajo se trata?
1. Trabajo no remunerado (incluso estudiantes)
2. Trabajo manual que no requiere experticia o solo cierta experticia
3. Trabajo general de oficina o secretaria
4. Artesano, técnico, informático, enfermera, artista o equivalente formado profesionalmente
5. Profesional formado académicamente o equivalente (pero no director)
6. Director de uno o más subordinados (no-directores)
7. Director de uno o más directores
25. ¿Cual es su nacionalidad?
26. ¿Cual es su nacionalidad de nacimiento?
Muchas gracias, usted es muy amable
Appendix 2
The complete calculations for the index results
Source:
Indexes from Spain
Power Distance Index (PDI)
PDI = –35m(03) +35m(06) +25m(14) –20m(17) –20
= –(35 X 2.19) + (35 X 2.65) + (25 X 3.13) – (20 X 2.94) –20
= -76.65 + 92.75 + 78.25 – 58.8 – 20
PDI = 15.55
Individualism Index (IDV)
IDV = –50m(01) +30m(02) +20m(04) –25m(08) +130
= –(50 X 2.1) + (30 X 2.1) + (20 X 2.03) – (25 X 2.55) +130
= –105 + 65 + 40.6 – 63.75 +130
IDV = 64.85
Masculinity Index (MAS)
MAS = +60m(05) –20m(07) +20m(15) –70m(20) +100
= +(60 X 2.03) – (20 X 2.26) + (20 X 3.39) – (70 X 3.26) +100
= + 121.8 – 45.2 + 67.8 – 228.2 +100
MAS = 16.2
Uncertainty Avoidance Index (UAI)
UAI = +25m(13) +20m(16) –50m(18) –15m(19) +120
= +(25 X 2.65) +(20 X 2.26) – (50 X 3.03) – (15 X 2.77) +120
= +66.25 + 71.6 – 151.5 – 41.55 +120
UAI = 64.8
Indexes from the United Kingdom
Power Distance Index (PDI)
PDI = –35m(03) +35m(06) +25m(14) –20m(17) –20
= –(35 X 1.77) + (35 X 2.39) + (25 X 3.16) – (20 X 2.19) –20
= -61.95 + 83.65 + 79 – 43.8 – 20
PDI = 36.9
Individualism Index (IDV)
IDV = –50m(01) +30m(02) +20m(04) –25m(08) +130
= –(50 X 1.77) + (30 X 1.58) + (20 X 1.97) – (25 X 2.16) +130
= –88.5 + 47.4 + 39.4 – 54 +130
IDV = 74.3
Masculinity Index (MAS)
MAS = +60m(05) –20m(07) +20m(15) –70m(20) +100
= +(60 X 1.58) – (20 X 2.45) + (20 X 2.32) – (70 X 3.39) +100
= + 94.8 – 49 + 46.4 – 237.3 +100
MAS = -45.1
Uncertainty Avoidance Index (UAI)
UAI = +25m(13) +20m(16) –50m(18) –15m(19) +120
= +(25 X 2.81) +(20 X 2.32) – (50 X 2.19) – (15 X 3) +120
= +70.25 + 46.4 – 109.5 – 45 +120
UAI = 82.15
References
Hoecklin, L., (1995), “Managing cultural differences: Strategies for competitive advantage”, London: Economist Intelligence Unit/Addison Wesley.
Hofstede, G., (2001), “Cultures Consequences: Comparing values, behaviours, institutions, and organisations across nations”, Second Edition, Thousand oaks, CA: Sage.
Hofstede, G:
Holden, N., (2002), “Cross-Cultural Management: A knowledge management Perspective”, Pearson Educated Limited
McSweeney, Brendan, (2000), “Hofstede's model of national cultural differences and their consequences: a triumph of faith - a failure of analysis”, Published in Human Relations, Vol. 55, No. 1, January, pg. 89-118
Nymark, S. R., (2000), “Organizational storytelling: Creating enduring values in a high-tech company”, Odense: Forlaget Ankerhus.
Trompenaars, F. and Hampdon-Turner, C., (1993), “Riding the wave of culture: Understanding cultural diversity in business”, London: Economist Books
Trompenaars, F. and Hampdon-Turner, C., (2000), “Building cross-cultural Competence: How to create wealth from conflicting values”, John Wiley & Sons ltd.