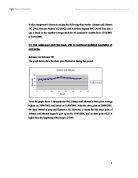
This may engender autocorrelation, which is more likely to arise when utilising time series for regression analysis. Serial correlation, an equivalent term, occurs when the disturbance term picks up ‘outside influence’ from variables and can persist over time. The Durbin-Watson (DW) test computes this on a scale from 0 to 4, where positive correlation is closer to 0 and negative correlation closer to 4. A value closer to 2 means there is no correlation. In this instance, the DW stat is 1.52, exhibiting slightly positive correlation, though it is also above the upper bound value and hence it is insignificant. The small positive correlation can be seen on the residual graphs which tend to display small patterns. In general, autocorrelation does not indicate that the OLS coefficient estimates are biased, although BLUE is no longer valid since one of the Gauss-Markov assumptions is no longer satisfied. However, if the serial correlation is due to variables being incorrectly omitted from the model then bias is likely. If there is positive serial correlation then it is very likely that the OLS estimates of the coefficient standard errors will be biased downwards. This will mean that the t-ratios are likely to be too high.
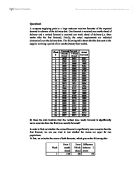
In order to carry out certain tests we need to work out the number of degrees of freedom (df), that is, the number of observations in the sample minus the number of parameters estimated (the number of rows in the middle panel). In our example, df= 43–2 =41. By observing the t-statistic against the critical values, we can see that it is large. Therefore we could reduce the risk of a Type I error (of falsely rejecting the null hypothesis) to 0.1 percent by using the 0.1 percent significant level. The lower the significance level, the higher the power of the test will be. Given that the t-statistic is larger than the given critical value, the estimated coefficient is said to be ‘statistically significant’ (i.e. coefficient is nonzero). The p-value (Prob), on the other hand, is not literally 0.0000 as it has been rounded to 4 decimal places which demonstrates that its magnitude is negligible.
One of the ways of working out which is a good estimator is to assess heteroscedasticity. This means ‘differing dispersion’ and occurs when the variance of the disturbance terms is not the same for all observations. Its presence makes the OLS estimators inefficient because, in principle, we could find alternative estimators with smaller variances. Similarly to autocorrelation, the estimators of the standard errors of the regression coefficients will be wrong. They are computed on the assumption that the distribution term is homoscedastic. Thus there will be bias and accordingly, the t and F tests are invalid. It is likely that the standard errors will be underestimated, so the t statistics will be overestimated and the precision of the regression coefficients will be deceptive. In order to see if our regression is affected, we perform a White test. It looks more generally for evidence of an association between variance of the disturbance term and the regressors. We can use R2 as a proxy. Since its value of 0.12 is far less than the 5% significance level even at 30 degrees of freedom, we can assume there is no heteroscedasticity. However, this form of testing lacks power because of its generality.
Denmark (February 2011). Annual IFS series
Chris Dougherty, Introduction to Econometrics (Page 227), Third Edition, Oxford University Press