Note of caution
It should be noted that the survey was up on the Website for one day during the summer holidays. It therefore represents a snapshot of visitors at a particular time of year, rather than a conclusive summary of annual visiting patterns. The survey will be repeated during the autumn term, and at intervals throughout the year to explore seasonal fluctuations in visiting patterns.
The return rate of 5.5% represents a relatively high response rate for web surveys where return rates of 2% - 4% are standard. However, it should be noted that the responses of the sample taken may not be representative of the total population of Web visitors.
Please note that the physical audience profiling data has only been collected for 6 months. Therefore figures quoted for the physical visitor profile below may alter once a full year’s data has been included. The data given for physical visitors excludes school groups to allow the best comparison for the Web survey, which was taken during school holidays.
RESULTS
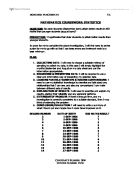
GENDER
There is no significant difference between the gender profile of Web and physical visitors.
Table 1: Gender profile of the Museum’s Website visitors
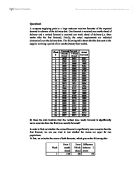
AGE
This data showed the most significant difference between the profile of the Museum’s physical and virtual visitors. A much smaller proportion of Web visitors were children under-11 (2.8% against 22.5% of the physical audience). A much larger proportion of the Web audience were young-middle aged adults aged 19-59 (84.5% against 60.6% of the physical audience).
Table 2: Age profile of Website visitors
COUNTRY OF RESIDENCE
Web visitors are predominantly from the UK (80.3%). Only 19.6% of virtual visitors live overseas. This broadly matches the proportion of physical visitors from overseas. Overseas virtual visitors are spread over many countries, a pattern which is similar to that of physical visitors. 8.4% of virtual visitors live in Europe, while 6.0% are from North America. The USA is the other major single country from which people access the site.
Table 4: Percentage of visitors to the Museum Website by country of residence.
UK GEOGRAPHICAL SPREAD
A high proportion of the Museum’s virtual visitors are from London and the South East (78.6%). This reflects the pattern among physical visitors.
Table 5: Geographical spread of Website visitors resident in the UK
ETHNICITY
Bearing in mind that the majority of the virtual audience is from London and the South East, the proportion of virtual visitors from ethnic minority groups (11.6%) is comparable to that of the actual population in this area (9.9%)¹. It is noticeable, however, that Asian visitors are slightly over-represented in the Web audience (compared to their numbers in London and the South East), whereas black virtual visitors are under-represented. This pattern is repeated for the Museum’s physical visitors.
Table 6: Ethnic/Cultural identity of Website visitors
¹Figures are from the Office for National Statistics, 1991 census.
EDUCATIONAL ATTAINMENT
The proportion of both Web visitors and physical visitors who have studied at Polytechnic or University level is very high compared to national figures. It is difficult to compare with national data exactly because of differences in categorisation. However, in 2000, only 12.6% of UK adults over 15 had finished their education when aged 21 or over (i.e. were probably graduates or post-graduates)¹. By way of contrast around 60% of both virtual and physical audiences are educated to Polytechnic/University level.
Table 7: Educational level of visitors to the Museum Website
¹ Figures are taken from National Readership Survey, January – December 2000.
Note: The quantity of missing data for this question on the Web survey was significantly higher than for any other question in the pop-up survey. Review of the missing data shows that it is made up mainly of adult UK respondents. It is not clear why this should be the case, though it is reasonable to surmise that this may be a sensitive or embarrassing question to answer.
EMPLOYMENT STATUS
The proportion of people in full time work is significantly higher for Web visitors than for physical visitors. There were no other significant differences.
Table 8: Employment status of adult (18+) visitors to the Museum Website
Note: Respondents could tick more than one answer to this question therefore the total percentages are greater than 100.
GENERAL PATTERNS OF INTERNET USE AMONG VIRTUAL VISITORS
Table 9: Where respondents usually access the Internet from
This question asked Website visitors where they usually access the internet from, not where they were accessing it from at the moment of answering the survey. Respondents could tick more than one answer, therefore total percentages are greater than 100.
The above table suggests that a high proportion of the Museum’s Web visitors are accessing the Internet from work (40.5 %). National statistics on where people access the Internet from show considerable variation. For example the figures for people accessing from work vary from 16%¹ to 37%². The findings for the Museum’s Web survey are consistent with the higher figure.
¹ Figures are from ‘Social Trends’ National Statistics © Crown copyright 2001
² Figures are from the National Statistics Omnibus Survey, April 2001
Table 10: How often Website visitors use the Internet per week
Note: Website visitors were asked how often they used the internet each week. As well as giving an idea of general patterns of internet use among the Museum’s Website visitors, this data can also be used as an indication of how ‘internet-savvy’ the audience is.
Table 11: Main reasons for using the internet in general
In this question visitors were given fifteen options to choose from. Respondents could select more than one option if applicable. Within the ‘other’ option, respondents were asked to specify their reason.
FREQUENCY OF VISITS TO THE SCIENCE MUSEUM SITE
The proportion of Website visitors who were first time visitors to the Museum Website, is very similar to the proportion of first time physical visitors (76.9% versus 78.4%)
Table 12: How often respondent visits the Science Museum Website
REASONS FOR VISITING THE SCIENCE MUSEUM WEBSITE
Table 13: What respondents were looking for on the Science Museum Website
Respondents were asked to choose which of twenty possible options they were looking for on the Science Museum Website on the day of the survey. They could select more than one option if applicable, therefore the total percentage is greater than 100.
Within the ‘other’ option, respondents were asked to specify their reason. Of the 11 people who ticked this category 2 specified In Touch and 2 mentioned IMAX.
REASONS FOR VISITING THE SCIENCE MUSEUM WEBSITE (GROUPED BY TYPE OF MOTIVE)
Almost three quarters of virtual visitors were visiting the site for information related to visiting the Museum.
Table 14: Motive for visiting the Science Museum Website, grouped by whether these were visit-related, research-related, or ‘other’
Table 14 was calculated by grouping responses to the question ‘what were you looking for on the Science Museum Website today?’ shown in table 13 above.
Visit related motive
The variable ‘visit-related motive’ includes the options:
- Information to help plan a personal visit
- An overview of what’s in the Museum
- Information about new exhibitions
- Information to help plan an educational visit
- Follow-up information after a visit.
Research-related motive
The variable ‘research-related motive’ includes the options:
- General information about science and technology
- Online access to collections and exhibitions
- Links to other sites and resources; Information about contemporary issues
- Chance to comment about science issues
- Information related to a hobby or special interest
- Material for use in teaching
- Information for a homework project
- Research (college/university/tertiary level)
- Special on-line exhibitions.
‘Other’ motive
The variable ‘other motive’ included the options:
- Fun/interactive activities
- On-line shopping
- Looking for job opportunities
- Looking for staff-contact details.
BACKGROUND INFORMATION ON WEBSITE USEAGE FROM LOG DATA
Log data information
Detailed statistics on usage of the Science Museum’s Website are collected via the log data. The following selected tables and graphs give useful background to the profile of the Museum’s Website visitors. Please see http://www.sciencemuseum.org.uk/usage/ for full statistics from the log data.
Table 15: Information on how the Science Museum Website is used, obtained from log data for 2000-2001
Graph 1: Two-year visiting patterns
The following graph shows fluctuations in patterns of Website visiting over the past two years. It is difficult to interpret the individual peaks and troughs in the graph due to changes in collection methods. However, the overall trend is an increase in visitor numbers to the site.
Note on search phrases
The log data also provides data on search phrases used to access the site from external search engines. This data provides interesting information on the sorts of topics users are interested in when they enter the site. An initial review of the data showed that a very wide range of search phrases are being used. A high proportion of these comprised combinations of the words ‘science’ and ‘museum’. A detailed analysis of the search phrases would give an idea of the most common topics under which visitors enter the site. However, because of the amount and range of data, this analysis would need to be done separately to this report.
Acknowledgements
Thank you to Mike Ellis and Daniel Evans for their help with this project.