Sociological Perspective concept of ill health
Pattern and Trend in Health and illness
The 3 social groups I will be comparing with will be:
* Social Class
* Ethnicity
* And Gender
Ethnicity:
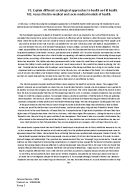
From the data on the right, it shows clear evidence that South Asia has a longer mortality rate compared to the rest of the world. Caribbean and West Africa shows that they are below the standard mortality rate. There are clear reasons suggesting why Caribbean and West Africa fall below the standard mortality rate whiles south Asia having the highest.
Asian people have great knowledge into knowing what's good for their health and generally knowing how to take care of themselves. Because of this, they avoid unhealthy food such as fried oily dishes where consuming more healthy food such as steam fish. Because due to their good life style and diet, it helps and contributes their mortality rate much higher.
European has the next highest mortality rate where they fall behind South Asia. Because Europe is a fairly rich economy, the people can afford to eat decent meals. However, it's because European does not know how to take care of their diet the same way Asian people does, their mortality rate is affected being lower. This may be due to eating more fried oily food where socially European has been referred to eating "fried fish and chips".
Caribbean and West Africa may not necessarily be consuming unhealthily, there are alternative reason into why their mortality rate is lower. Unlike the European, Caribbean and West Africa is not a rich economy. The society may not get a filling meal each day. Because of this, their health is affected of not having a good nutritional diet and therefore increasing the chance of dying at an early age. This therefore is shown in the result having the two economies being very low.
In this graph, it shows the perinatal mortality rate of different economy. This includes Pakistan, Caribbean, Bangladesh, India, E Africa and UK. It shows Pakistan having the highest rate per 1000 live and still births while UK having the lowest. This may be due to many health reasons. Comparing Pakistan and UK, Pakistan does not have the essential support in health to where UK has. This is because for example, UK has many health clinics such as the NHS where it enables people to have health routine checks and more. Pakistan in the other hand does not have this type of luxury where it is available to the public. Even if there is this service, it will cost too much and simply, they cannot afford it due to being within a poor economy.
The graph also shows an order where which country is rich and unhealthy which is shown by having the economy going downwards from Pakistan being unwealthy to UK being the lowest in perinatal mortality rate being the most wealthiest.
Some people may come from different culture so therefore have a language problem to communicate. Therefore, they would not go to the doctors.
Gender
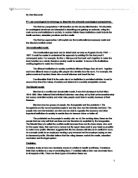
From this graph, it is comparing the health and illness of both sexes. Each has it own high and low areas.
On the graph, it shows male having a total death of 109,094 while's females having a total death of 72,486. Male and female in general have different life styles. Male are generally more physical and females are less physical. Males may have a highest death rate due to ...
This is a preview of the whole essay
Some people may come from different culture so therefore have a language problem to communicate. Therefore, they would not go to the doctors.
Gender
From this graph, it is comparing the health and illness of both sexes. Each has it own high and low areas.
On the graph, it shows male having a total death of 109,094 while's females having a total death of 72,486. Male and female in general have different life styles. Male are generally more physical and females are less physical. Males may have a highest death rate due to their life style which involves doing more dangerous activities such as riding motor cycle. This therefore will enhance their chances of dying. This is the reason of men having higher injury and poisoning percentage.
Men and women have different appetite, therefore different diets. Women tend to eat more healthily where not consuming heavy products such as fried food and meat where it is bad for the health. Because men enjoy eating delicious food which is high in carbs and calories, it is not good for their health, this therefore will increase the chance of dying. This is reflected in the coronary heart disease where this lifestyle of diet is reflected back.
Men have a higher risk factor to those of women. This is because men tend to do higher level of smoking and drinking too of women. This affects their health considerably.
Good health means differently in different culture. People may think they don't need to eat healthy and do exercise. It varies upon people.
Some people are less willing to go to the doctors, this therefore affect their health if there is a problem. For women, some culture prohibits women to get into close contact with male so therefore disallow them to go to doctors.
Social Class
Different class have different lifestyles. In this graph, it shows how different social class have different health standards where it shows the professional being at the top of the chart which represents them being the "best". It goes downwards from Managerial; skilled towards the end is the unskilled. The chart shows how each class slowly goes down in health standard where the unskilled is at the lowest.
Many factors reflect back towards these results. Due to professional having a good income, they generally will have a better life where they can afford the things they want, ie, the best foods, the best lifestyle and more. They don't need to suffer from unhealthy food, bad lifestyle where they can get other people to do it for them. This reflects back to their health and people doing the hard work.
There is then the skilled where they are specialised in one area where they have a steady income, and a moderate lifestyle. Because they have a good income and a better lifestyle than those who are unskilled, they have a better health standard. Of course, their health standard will not be the same as those who are professional; this is because the skilled need to work for their living whiles the professional does not need to do the hard work.
The unskilled has the lowest rate in the chart. This is because they may not have a steady income or possibly no income at all. This then reflect to their life style and diet which they can't afford the luxury, food and much more which affects their health. They live on basic things, can't eat healthy food which result in cheap fast food. This than increases many disease in their health such as heart disease which then reduces their life span.
Social class is reflected in this diagram. I will begin explaining with occupation. Occupation enables people to have an income which determine how good a person can live their life, whether it is to buy luxury, good food or more, it is all determined in their job and the salary income they get. The occupation also reflects back to their health whether what job they do will determine how physical they need to get. Job such as higher managerial, administrative, professional accountant, bank manager, dentist, doctor, solicitor, these jobs is not physical labour so it is better for their health. Job such as Cleaner, builder, lorry driver, assembly line worker is much hard work which require physical attribute so it wouldn't be great for their health.
The black report
It is clear that the different social class have different health quality. These problems are linked to the income, unemployment, poor environment, poor housing, and education. The diagram is clear. People that are unemployed can't afford to live in a luxury area so therefore they need to resort into living in a poor environment. If they have a family, they need to change school where education in a poor environment may not be good as those in a better environment. This then re begins the chain where the child will have a poor education so therefore they won't have a good career which affects their income and social class.
M3
Statistical artefact
Statistical artefact is when statistic that is carried out may be wrong and biased. This can be due to researching an area that has a high percentage of the following researching area. So for example, if a particular area has a high percentage of low class people, reaching that area will of course give you that statistic. And due to people from that area is low class, that therefore means they have a labour work of some sort.
This therefore will represent younger people working in offices.
In addition, this suggest that it is not the social class but its the age structure and patterns which determine the employment of people in the low class.
However, new studies had show that there is a link between low social class and a higher level of illness.
Natural or social selection
This explanation suggest that it is not the low social class, poverty, low wage and poor housing that causes illness but it is the lower life expectancy for adult and high level of infant mortality rate. It suggest that people in the lower class are in the lower class due to having poor energy and health which is needed for success and finding jobs. This is not necessarily true as because there is not health cause which make people being within a low social class but rather it is caused by deprived circumstances.
Cultural or behavioural explanations
This explanation suggest that people from a lower social class is more likely to drink, smoke, eat junk food and do insignificant exercise which is the cause of the illness that they get, ie bronchitis, diabetes and more. This is very accurate as eating those category is all negative to the health which is harmful which can only damage but not improve on. Low social class have a lower mortality rate due to these lifestyle they follow.
It also suggest that these may not be true as drinking and smoking for example helps people to relief pain, and cope with difficult times. It help people think and not do regrettable things.
Material or structural explanations
Low social class has been said to have a lower life expectancy and infant mortality rate are higher suffers from poorer health to other social class. This is said to be the cause of inequalities in wealth and income. This is very true as because low social class will have a low income which therefore they can't buy the luxury such as good nutritional food than those higher social class can afford. Because of being within a low social class, their environment wouldn't be grand as well. In addition, they will also be living within a poor dangerous environment which there may not be available jobs for people. This then will continue the chain of low social class where new people can't develop into success.
D2
Black report suggests there are 5 main factors which affects health. This is income, occupation, education, housing and lifestyle. This brings back to 4 explanations which is the artefact, social selection, material and cultural. These 4 are offered to account for the statistical trends. In addition, there are only 2 in the 5 trends which explain the patterns of morbidity and mortality.
Firstly, there is the artefact. Artefact shows a biased and inaccurate research statistic. Therefore it is not accurate in determine the health and illness of a person's health. This explanation therefore concludes that there is no real causal relationship between a person's class and the quality of a person's health.
Social selection shows that there is an acceptance that the health and class are related. Health is determined by the social class for which determine how well a person live their life, ie, good lifestyle, good food and more. Living a good life will result of having a longer life span due to not doing hard labour work. Bad health is related on being in a low sicla class where they need to suffer from hard work.
Next there is material. Material suggest people in the low social class have a higher level of health problem due to the lifestyle and wealth they have. People who live in poverty cannot afford good nuitritional food so therefore they will resort to quick cheap fast food which is bad for their health. And because they live within a poor environment, education, jobs, housing is very poor. This will result in having a poor education for young pupil which will continue the cycle of poverty which will result in poor health and illnesses. This will therefore affect the population of young pupil and the elderly. Poor environment will have poor facilities. Therefore the environment will also be very unhygienic which will result to more illnesses.
Cultural explanation is an argument that suggest poor health have more to do with cultural practices and beliefs. Therefore it argues it over the material disadvantages. Different culture have different views. They have different idea of public health service and follow traditions. So they have their own knowledge of health and treatments.
The first two-explanation artefact and social has not been recognised to be accurate in the medical debate. The last two material and cultural is favoured by the debate which explains the pattern of morbidity and mortality.
Calvin Chan - Sociological Perspectives Assignment 2