
The heights of 16-18 year old young adults varies between males and females. My prediction is that the majority of males are taller than females.
Statistics coursework S1 Task A: Measurements The heights of 16-18 young adults varies between males and females. My prediction is that the majority of males are taller than females. I have decided to take a sample of 100 16-18 young adults from Havering Sixth Form College and measure their heights with a tape measure. My two populations will be male and females and I will obtain 50 male heights and 50 female heights. I have chosen to take a sample of 100 because small sample sizes may give inaccurate results whereas a larger sample size may be impractical and time consuming. Therefore I feel a sample size of 100 will give a efficient set of results and a meaningful conclusion could be deduced. To insure that the data I collected wasn't biased I didn't look at each persons height to ensure that the data I collected was even for both populations and within both populations. Also because height isn't affected by whether you are athletic or not or whether you eat lots or who you are friends with, the data I collected cant be bias for that aspect of my data collection and also I didn't collect my data at a modeling studio, of which nearly everyone there would be over 6ft and would make my data collection bias and unfair. So overall the data I collected wasn't bias and was accurate to use for my investigation. I decided to investigate the difference in heights between
data handling
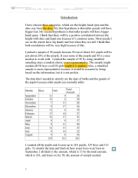
Introduction I have chosen three categories, which are the height, hand span and the shoe size from the data. My first hypothesis is that taller people will have bigger feet. My second hypothesis is that taller people will have bigger hand spans. I think that there will be a positive correlation between the height with shoe and hand size because it's common sense. Most people I see on the streets have big hands and feet when they are tall. I think that both correlations will be very high because of this. I picked a sample of 50 people because 50 out of about 261 pupils will be just about 20% of the people. It uses some of the people and 50 is a nice number to work with. I picked the sample of 50 by using stratified sampling since a random choice is not representative. The sample might contain all 50 boys or all 50 girls might it is random. Also, a stratified sample is more representative because it would be accurate by being based on the information, but it is not perfect. The data that I needed to stratify are the date of births and the gender of the pupils because older pupils are normally taller. Months Boys Girls Total Amount September 1 9 20 October 4 6 20 November 7 3 20 December 9 7 26 January 3 6 9 February 7 0 27 March 5 7 32 April 9 8 7 May 9 1 20 June 2 3 25 July 9 6 25 August 4 6 0 29 32 261 I counted