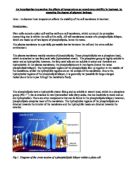
An investigation to examine the effects of temperature on membrane stability in beetroot, by assessing the degree of pigment leakage.
An investigation to examine the effects of temperature on membrane stability in beetroot, by assessing the degree of pigment leakage.
Aim: - to discover how temperature affects the stability of the cell membrane in beetroot.
Introduction:-
Plant cells contain a plant cell wall as well as a cell membrane, which surround the protoplast (everything that is within the cell) of the cells. All cell membranes consist of a phospholipids bilayer, which are made up of two layers of phospholipids, hence the name.
The plasma membrane is a partially permeable barrier between the cell and the extra cellular environment.
The plasma membrane mainly consists of phospholipids. These phospholipids are a phosphate head, which is attached to two fatty acid tails (hydrocarbon chain). The phosphate group is highly soluble in water and so hydrophilic; however, the fatty acid tails are not soluble in water and therefore are hydrophobic. In the plasma membrane, the phospholipids are in two layers (hence the name phospholipid bilayer). The hydrophobic regions of the phospholipids line up together in the middle of the membrane, whilst the hydrophilic regions are on the outside of the membrane. Due to the hydrophobic regions of the phospholipid bilayer, it is generally not possible for large charged molecules or ions to pas through the membrane freely.
The phospholipids have a hydrophilic (water liking and so soluble in water) head, which is a phosphate group (PO4³¯) that is attached to two hydrocarbon tails (fatty acids, that are insoluble in water and so are hydrophobic). There are other components that can be found in the phospholipids bilayer; however, phospholipids comprise most of the membrane. The hydrophobic regions of the phospholipids are directed towards the interior of the membrane and the hydrophilic heads are directed towards the exterior.
Fig 1. Diagram of the cross-section of a phospholipids bilayer within a plant cell.
The phospholipids bilayer acts as a barrier between the protoplast and the surroundings of the cell as well as controlling what enters and leaves the cell. The bilayer is impermeable to ions and large polar molecules due to the hydrophobic regions within the phospholipids bilayer. However, specialised proteins within the bilayer, allow movement of these substances.
It is selectively permeable and controls what enters and exits the cell. It does this by the proteins that are in it, however small lipid molecules, non-polar molecules and small water molecules can enter and exit the cell straight across the membrane through the phospholipids. This is due to the properties and size of the molecules, which enable them to do so. Extrinsic and intrinsic proteins in the cell membrane help other the molecules enter or leave the cell by either facilitated diffusion or active diffusion.
Some of these transport proteins are lined with the hydrophilic R-groups of the proteins amino acids, which only allow certain charged molecules and ions to pass through. Different proteins are specific to certain molecules hence the cell membrane being selectively permeable. These transport proteins allow molecules to diffuse through the phospholipid bilayer; diffusion is the movement of molecules from a high concentration to a lower concentration down a concentration gradient.
The use of these transport proteins means that the type of diffusion that is occurring here is facilitated diffusion; this means that something is helping the molecules to diffuse through. However, no energy is required in diffusion.
Proteins are built up from smaller subunits called amino acids. These amino acids are made up from an amine group, a carboxylic group and a side chain, which differs from amino acid to amino acid. This side chain is known as the R-group, it is what makes amino acids different from one another. Depending upon what is within the R-group of the side chain of an amino acid, the amino acid can have one of four properties: acidic, basic, hydrophilic or hydrophobic.
Acidic R-groups donate H+ ions, whereas basic R-groups will receive H+ ions. Hydrophilic R-groups are soluble within water and are so water 'loving', whereas hydrophobic R-groups are not soluble in water and are water 'hating'. The properties of the R-groups on amino acids within a protein are very important as they affect the characteristics and functions of the protein.
A protein can be described in four parts; the primary structure, secondary structure, tertiary structure and quaternary structure.
The primary structure relates to the sequence and number of amino acids that make up the polypeptide chain within the protein. If just one amino acid were different within the chain, then the protein itself would be very different.
The secondary structure relates to whether the polypeptide chain is mainly alpha helical, or beta pleated. A polypeptide chain that is mainly alpha helical will mean that more of its structure is wound into a coil, whereas a polypeptide that is mainly beta pleated will have more of its structure folded back onto itself (like a concertina). Hydrogen bonding between the oxygen of the carboxyl groups and the hydrogen of the amine groups occurs to hold the alpha helixes or the beta pleated sheets in place, to give it a more rigid structure.
However, these hydrogen bonds are not very strong. They are not actually bonds, but in fact strong attractions.
The tertiary structure of a protein refers to the specific 3D shape that the polypeptide chain folds into. Here the R-groups of the amino acids within the polypeptide chain are very important as they are effectively what determine the shape of the protein. Generally hydrophobic regions of the polypeptide chain will be in the centre of the molecule and hydrophilic regions will tend to be on the outside due to their nature. Hydrogen bonds, disulphide bridges, ionic bonds and hydrophobic interactions occur between the R-groups of the amino acids. Together these strongly hold onto the shape of the protein.
The quaternary structure merely describes whether a protein is made up of more than one polypeptide chain.
Temperature affects the proteins within the membrane as when there is enough heat, the molecules within the proteins gain kinetic energy. This causes them to vibrate, with more heat, comes more kinetic energy, so more vibration. Eventually the vibrations of the molecules within the protein will cause the bonds and attractions within the protein to be broken, so altering the shape of the precise 3D shape of the protein. First the weak hydrogen bonds are broken, and then the disulphide bridges (covalent bonds), then the ionic bonds and finally the hydrophobic interactions are broken due to the disturbance caused by the vibrations of the molecules.
Once a protein has changed in shape, it is said to have been denatured. This can be either temporary of permanent. The denaturisation of the protein means that it is no longer specific and so will allow almost any molecule or ion to pass through the membrane. This is as the inside of a transport protein, where the molecules or ions pass through, is lined with a type of R-group. These particular R-groups will only allow certain molecules or ions to pass through, depending upon which R-groups line the inside of the protein. So, once a protein becomes denatured, some of these R-groups may move away from the lining and different R-groups may take their place. This would mean that molecules and ions that were able to pass through before, can now longer do so, or that molecules and ions that were not able to pass through before, can now.
The pH of the surroundings of a cell can also denature a protein. If the surroundings are too acidic or alkaline, this alters the amount of either basic or acidic R-groups within the protein
and so alters the ability of the protein to be specific as the R-groups that line the inside of transport proteins are what make transport proteins specific.
The fluidity of the phospholipids bilayer can be affected by the fatty acid tails that make up part of the phospholipids. These fatty acid tails are made from carbon and hydrogen atoms. Carbon is able to have four single bonds at most and hydrogen can only have one single bond. When a carbon has all four single bonds, it is said to be saturated as it has the maximum number of single bonds that it can make. This allows the phospholipids and other components of the bilayer to fit together as closely as possible (without being too rigid) and so the bilayer is not very fluid.
Fig. 2 Saturated fatty acid
However, the carbon atoms within the phospholipids can also make carbon double bonds (C=C), where two carbons bond with each other twice. The fatty acid is said to be unsaturated, as the maximum number of single bonds for each carbon atom have not been fulfilled. The double carbon bond causes a 'kink' to occur in the fatty acid, which means that the next phospholipids cannot fit as closely to it as it would have been able to if the fatty acid was saturated. This makes the cell membrane more fluid as there are gaps within the bilayer; this also makes it more permeable. Some fish adjust the proportion of the two fatty acids within their phospholipids bilayers according to the temperature of the waters that they are migrating through. Therefore, we know that temperature also affects cell membranes.
Fig. 3 Unsaturated fatty acid
Beetroot contains a pigment/s; I will be recording the amount of pigment that leaks out of the beetroot samples within different temperatures. We assume that the pigment that is in beetroot is anthocyanin.
Anthocyanins are representatives of a large group of flavorous plant pigments responsible for most of the red, blue, and intermediate colours of flowers and fruits attracting insects or higher animals for the purpose of pollination or seed distribution. They are water soluble glycosides with some or all of their sugar groups removed. The colour results from the positive charge distributed over the chemical ring, the colours are dependant upon the pH of the medium that the pigment is in.
However, the pigments that are actually found within beetroot are betalain pigments; betalain is never found in plants containing anthocyanin, the two are structurally unrelated. The nitrogen containing betalains can be divided into two groups.
DOPA-dioxygenase is the key enzyme involved in betalain biosynthesis. It converts 3,4-dihydroxyphenylalanine to betalamic acid. There are two things that can then happen to the betalamic acid; it can condense with amino acids/amines to form betaxanthin, or condence with clyco-COPA derivatives to form betacyanin. They are synthesized in the cytoplasm, then filtered out and stocked in vacuoles. The synthesis of these two pigments is a highly regulated function of the plants. Betacyanins usually appear to be red to red-violet in colour, whereas betaxanthins generally are yellow in colour. Betacyanins absorb in the 535-550nm range and betaxanthins absorb in the 475-480nm range.
Beetroot contains 2 Betacyanins Betanin and a derivative.
Fig. 4 Diagram of a Betanin molecule that can be found in betacyanin
Betalain replaces anthocyanins in Caryophyllales order of plants (cacti, beets etc and some fungi), their functions are unknown, although it is thought that when present in flowers, it attracts pollinating insects and when present in seeds, it attracts birds, which disperse their seeds. Betalains differ from anthocyanins in that they do not change colour when the pH changes, i.e. they are not pH indicators.
The properties of the tonoplast and cell membrane mean ...
This is a preview of the whole essay
Beetroot contains 2 Betacyanins Betanin and a derivative.
Fig. 4 Diagram of a Betanin molecule that can be found in betacyanin
Betalain replaces anthocyanins in Caryophyllales order of plants (cacti, beets etc and some fungi), their functions are unknown, although it is thought that when present in flowers, it attracts pollinating insects and when present in seeds, it attracts birds, which disperse their seeds. Betalains differ from anthocyanins in that they do not change colour when the pH changes, i.e. they are not pH indicators.
The properties of the tonoplast and cell membrane mean that the pigment does not leak into the cytosol or the extra-cellular sap of the beetroot. If the beetroot is cut, cells are sliced open and the pigment spills out. However, if the membrane is altered more subtly, leakage (diffusion) of betacyanin is induced.
I predict that as the temperature increases, the amount of pigment that leaks out will also increase as when the temperature increases that phospholipid bilayer will become increasingly more fluid. This is because with more heat energy (increase in temperature) there is more kinetic energy for the molecules that make up the cells. So, as the molecules that make up the phospholipid bilayer move, larger gaps are created between the phospholipids and other components of the bilayer. This enables the vesicles of betalains to pass through (diffuse) out of the cell, from a high concentration to a lower concentration, into the surrounding medium (distilled water). The extra kinetic energy that is gained from the increasing heat energy, will also allow the pigment to move more and therefore more should diffuse into the surrounding environment of the cell.
As well as the above, the transport proteins within the bilayer will become denatured due to the excessive heat energy that will cause the molecules making up the protein to vibrate. This in turn will cause the molecules to move and so break some or all of the bonds, which are holding them together, so denaturing the protein. This means that the transport proteins will no longer be specific and so will allow the pigment molecules to move in and out of the cell easily.
However, I feel that when the temperature is roughly at 0°C or below, there will be more pigment leakage than at a slightly higher temperature, say 10°C. This is because at these temperatures, the plant cells will freeze and thus die. The components of the phospholipid bilayer will contract and shrink due to being frozen and so the pigment will be able to leak out of the cell, aided by the water that will diffuse into the cell by osmosis.
The proteins within the phospholipid bilayer will not die or become denatured as there is not sufficient energy to overcome the bonds or attractive forces that hold the proteins together. However, as they too will become frozen, the proteins will partially lose some of their specificity. This means that some ions or molecules (mainly in this case, pigment) will be able to pass through the transport proteins, whereas in natural circumstances this would not occur due to the proteins being specific and so only allowing certain molecules or ions to pass through. Therefore, more pigment should be able to leak out of the beetroot cells at temperatures that are roughly 0°C.
Method
This experiment works as the pigment is contained within the cells. Therefore, it has to pass through the membrane of the cell in order to get out; this is why the amount of pigment that leaks out can be used to measure the permeability of the membrane.
In order to find out, which situations would be best for this experiment, I carried out some preliminary work before starting the actual investigation:
I needed to decide on:
* Which liquid would be best for putting beetroot in; distilled water, weak detergent or an alcohol (ethanol).
* The size of the sample of beetroot.
* The shape of the sample of beetroot.
* The volume of liquid that will be used.
* How long the beetroot will be left in the liquid for.
* The range of temperatures that will be used.
To decide on which volumes and types of samples to use, I would need to test out a variety of volumes and samples and then test the solutions in a colorimeter to measure the amount of pigment that has leaked out of the beetroot samples. From looking at the percentage of light that is able to pass through the different solutions, I will be able to figure out, which samples and volumes would be best to use. However, I will not be able to just rely on using the colorimeter; I will need to look at other factors, in choosing the right samples and volumes to use.
I had two options for the shape of the beetroot sample that I would be using; a cylinder or a cuboid. To create a cylindrical shape, I used a cork borer and a knife to cut the cylinder down to the length that I wanted it to be. To create the cuboids, I used the knife and judge purely by eye how exact the shape was, I then cut down the length of the cuboid by using a ruler.
I decided that using cylinders of beetroot would be the best shape as with the cork borers I can be assured that the diameter of the samples will always be the same if I use the same cork borer each time. However, with the cuboids, it is much harder to regiment the size and shape as it is almost all done by eye. Therefore, each sample of beetroot would not be exactly the same size and so would not have the same surface area, this would affect the experiment as more of the pigment in the beetroot would be able to leak out of the samples that have larger surface areas.
In deciding which liquid I would use in my real experiment, I placed 3cm³ cylinders of beetroot into 10cm³ of each liquid and left them in there for approximately 10 minutes. When testing the solutions in the colorimeter these were my results:
Table to show percentage of light that was able to pass through different liquids.
Liquid
Water
Ethanol
Weak detergent
Colorimeter reading
54%
46%
51%
From the colorimeter readings, it would seem as if ethanol would be the best liquid to use in the real experiment as the most pigment was leached from the beetroot sample into it. However, the weak detergent and the alcohol (ethanol) disrupt the nature of cell surface membrane, which in turn affects the permeability of the cell surface membrane. Whereas water does not, this is why I have chosen to use distilled water as my liquid in which to put the beetroot samples. Even though the detergent disrupts the nature of the cell surface membrane, the amount of light that was able to pass through was only slightly less than that which was able to pass through the solution from the distilled water and anthocyanin (pigment in beetroot).
To determine which length of beetroot cylinders to use, I placed 1cm³, 2cm³ and 3cm³ cylinders of beetroot into boiling tubes containing 10cm³ of distilled water in them and left them for approximately 10 minutes. When testing the solutions in the colorimeter, these were the results.
Table to show the percentage of light able to pass through solutions, which had contained different volumes of beetroot.
Length of cylinder
cm
2cm
3cm
Colorimeter reading
46%
25%
8%
From the colorimeter readings, it would seem as if the cylinder of beetroot that was 3cm in length would be the best size to use. However, I feel that the cylinder of beetroot that was 2cm in length would be best to use. This is as the percentage of light that was able to pass through the solution from the 1cm cylinder of beetroot is almost twice as much as that of the
solution from the 2cm cylinder of beetroot. However, the solution from the 3cm cylinder of beetroot allowed only 7% less light to pass through than the 2cm one did.
Once I had deduced the length of the cylinder of beetroot that I was going to use, I was able to find out the volume of distilled water that I would need to use. I placed 2cm cylinders of beetroot into boiling tubes containing; 4cm³, 6cm³ and 10cm³ distilled water, left them for 10 minutes and then tested the solutions in the colorimeter.
Table to show the percentage of light able to pass through the solutions, which had contained different volumes of distilled water.
Volume of liquid
4cm³
6cm³
0cm³
Colorimeter reading
29%
34%
68%
From the results, I could clearly see that 10cm³ of distilled water diluted the amount of pigment that leaked out of the beetroot sample too much. However, 4cm³ of distilled water barely covered the beetroot sample once it became turgid from osmosis. This would affect the
amount of pigment that will leak into the distilled water, as pigment in the parts of the beetroot that were exposed to the air instead of liquid would not leak out. I chose 6cm³ of distilled water as it covered the entire beetroot for the duration of time. Also the colorimeter readings for the 6cm³ of distilled water solution showed that only 5% more light was able to pass through it than the solution from the 4cm³ of distilled water. I consider that to be so small that it is practically negligible.
Lastly I looked at the length of time that I should leave the samples in the distilled water for. I placed 2cm³ cylinders of beetroot into boiling tubes containing 6cm³ of distilled water and left one for 3 minutes, one for 6 minutes and one for 9 minutes. Below are the colorimeter readings that I obtained:
Table to show the percentage of light that was able to pass through solutions that had contained beetroot for different lengths of times.
Time (minutes)
3
6
9
Colorimeter reading
60%
56%
48%
From the colorimeter readings, it is obvious to see that leaving the beetroot samples in the distilled water for 3 minutes is not enough time to allow the pigment to leak out. However, leaving the beetroot samples in for 9 minutes gives a solution, which only allows 8% more light to pass through it and therefore not much more pigment is leaked into the water. This means that I will leave my beetroot samples in the distilled water for 6 minutes during the real experiment. This should give the pigment plenty of time to leak out, whilst not being excessive.
I will be using a temperature range of 0°C, 20°C, 40°C, 60°C and 80°C as I feel that this will be a suitable enough range that will give me enough data to analyse in order to see the affect that temperature has on the permeability of cell membranes. I decided to have 0°C instead of 100°C in my range as at 100°C the water would be boiling and so much of the distilled water in the boiling tubes would escape and so the solutions would be far more concentrated than they should be. Also, excessive heat would cause the components in the cell to die and so all of the pigment would eventually leak out.
The apparatus that I will be using in this experiment are as follows:
* boiling tubes
* 500ml beakers
* stop clock
* 1 beetroot - all beetroot samples shall be taken from the same beetroot, so the
samples will be as similar as possible.
* knife
* cutting tile
* paper towels
* cork borer
* ruler
* 10ml measuring cylinders
* teat pipettes
* distilled water
* water baths, set to 40°C, 60°C and 80°C
* crushed ice
* thermometers - to measure fluctuations in the temperatures of the water baths
* colorimeter
* cuvettes
* boiling tube rack
There are no safety risks within this experiment, except the chance of scalding yourself on the hot water in the water baths. However, there is no need for protective gloves or safety spectacles as no dangerous chemicals are used.
The colorimeter comprises of a lamp, a filter that will be blue, a photosensitive element and a display. The substance is added from one of the boiling tubes into a cuvette, holding the cuvette on the 'grooved' side so that no finger print will affect the reading. The cuvette is then placed into the colorimeter with the notch facing forwards; the light will therefore shine through the clear sides on the cuvette.
The filter will be blue as this absorbs light that is emitted within the 440 - 490nm range, which corresponds to the range that betaxanthins absorb. Also filters are chosen by choosing the complementary colour of the solution that will be used. As I will have a red-pink solution and the complementary colour is blue, a blue filter would be the best choice as this would absorb as much of this colour light as possible. Whereas if a red or pink filter were to be used, the red/pink light would be reflected off the filter as it is unable to absorb this particular part of the visible light spectrum.
As the colorimeter is measuring how much light the substance in the cuvette will allow through, it obvious that the more red pigment that is in the cuvette the less light will be able to pass through as the substance is of a higher density because there is more pigment, which will absorb the light. The percentage of light that can pass through the samples is called the 'percentage transmission'.
To make sure the colorimeter is set up the same for each cuvette we put into it for a reading I will put a cuvette filled with distilled water in, in first and set the colorimeter to zero.
When cutting up the pieces of beetroot in the first place the membrane of part of the beetroot will be broken resulting is red pigment being lost. This acts as excess pigment, which we do not want to measure and therefore need to get rid of it. The best way of doing this is the rinse each piece of beetroot that I have cut under distilled water and then drying the samples with
a paper towel. This will get rid of that excess pigment and therefore I will only measure the red pigment that has been lost in the boiling tubes.
Making sure that you don't get any finger marks on the cuvettes when using the colorimeter is important because if any marks get on the clear sides of the cuvettes the cuvettes will be darker and therefore more light will be absorbed. This is also true of ensuring that there is no condensation on the cuvette as this could cause less light to be able to pass through the cuvette. Also making sure that I have read the thermometer reading at eye level will make sure that I have recorded the reading correctly.
Method
* Fill 15 boiling tubes with 6cm³ distilled water using the teat pipettes to fill a 10ml measuring cylinder. Then place 3 in each of the different temperature environments (water bath at 40°C, 60°C, 80°C, crushed ice and room temperature), to give the water time to adjust to the required temperatures before putting the beetroot in. Also place a thermometer in each of the environments.
* Using the cork borer, get some cylindrical samples of the beetroot. Then using the ruler and knife, on the cutting tile, cut off any skin that is on the beetroot (as this will affect the amount of pigment leakage as the skin is highly impermeable) and cut down the beetroot cylinders to 2cm in length, using the ruler.
* Record the temperature of the environments before placing any of the beetroot into them.
* Place a piece of beetroot into each of the 3 boiling tubes in one of the environments, starting the stop clock as soon as possible. (the second and third pieces of beetroot are my repeats)
* At 2 minute intervals, record the temperature of the environments and do so at the end of the 6 minutes as well.
* After 6 minutes, take the boiling tubes out of the environments, shake them (so that the pigment becomes distributed evenly throughout the solution) and pour some solution from each boiling tube into a separate cuvette.
* Zero the colorimeter by placing a cuvette with distilled water in it, then place the cuvette with the solution in it and read off the percentage of light that was able to pass through. Repeat this process for each of the solutions.
* Repeat this entire process for the rest of the environments.
By repeating the experiment twice, I will be able to find an average result for each of the temperatures and it will allow for any anomalies within my experiments and so make my results more reliable.
Apart from temperature of the environments, there are many other variables that I must consider within this experiment, which could affect the results that I obtain. Therefore, I must control them in order to make my results as accurate as possible. Controlling these factors will help to ensure that my experiment is as fair a test as possible.
Accuracy and precision of equipment used:
* Stop-watch: this read the time correct to the nearest milli-second.
* Thermometer: this reads the temperature correct to the nearest 0.5°C
* Ruler: this measures correct to the nearest 0.5mm
* 10cm³ measuring cylinder: this reads correct to the nearest 0.5cm³
* Colorimeter: reads correct to the nearest 1%
None of the equipment that I will be using will allow my measurements to be 100% accurate. However, as the same equipment will be used for all samples, these inaccuracies and loss of precision will not affect the investigation greatly.
Table to show variables that I will be controlling, measuring and varying within this experiment.
Variables to:
Control
Measure
Vary
Volume of distilled water used; if more distilled water were to be used in some boiling tubes, the solution that was then obtained at the end would be more dilute and so would allow a higher percentage of light through. However, if less distilled water were to be used in some boiling tubes, then the solution that was obtained would be more concentrated and so would allow a lower percentage of light to pass through.
The percentage of light that is able to pass through the solutions of distilled water and pigment, which has leaked out of the beetroot samples.
Temperature of the environments.
The length/width of the beetroot samples. It would be impossible for me to get all of the samples to all be 100% the same in size, mass and shape. However, I can make them as similar to each other in size as possible. This is done by using the cork borer (so all samples should have the same diameter), the knife and ruler aid in keeping them the same length. If the width/length of the samples differed, then those that were longer and wider would have a greater surface area and more pigment within them that could leak out. Those that are shorter and smaller in width would have less pigment and a smaller surface area and so less pigment would leak out of them.
The time that the beetroot are left in the distilled water for. If some beetroot are left in longer than others then they the pigment within those samples will have had more time in which to leak out of the cells and so the percentage of light that is able to pass through these samples will be less than it should be. However, if some have been left in for a shorter period of time than others, the pigment within them will have had less time in which to leak out and so the percentage of light that will be able to pass through these samples will be greater than it should be.
All the samples should come from the same beetroot. If some samples came from one beetroot and others came from another, then the investigation would become invalid. This is because the cell membranes from one beetroot to another will differ in their permeability. Even within the same beetroot, the permeability of the membranes can differ. However, by using one beetroot, we are ensuring that the membranes of the cells are as similar as we can possibly get them to be. Other beetroots may have less permeable membranes, which would mean that less of the pigment would be able to leak out, others may have a more permeable membrane and so more pigment would be able to leak out of the samples from them.
The shape of the samples. The shape of the samples should be the same as the volume of two shapes can be the same, but one may have a greater surface area than the other. If some samples are different shapes and so have different surface areas to other, there will be a greater chance for the pigment to leak out through diffusion, as the rate of diffusion can be increased by the amount of surface area that is available. So, those with a smaller surface area would have less pigment leaking out of them than they could possibly have.
The solution that the beetroot is immersed in. This must be kept the same, as different solutions would affect the permeability of the cell membrane, either making it more permeable or less so. This would mean that some samples would leak out more pigment, whereas others would leak out less pigment, than if all the samples had been put into the same solution.
The pH of the water in which the beetroot is in. This is because pH is a factor that can affect proteins, the hydrogen bonds in the proteins will break if too alkaline or acidic, denaturing the proteins. Therefore this has to stay constant to make sure it does not denature the proteins in anyway, consequently we will use distilled water, which has a constant pH of 7.
Ensuring that the beetroot samples are fully submerged. This is so that the maximum surface area is available for the water to diffuse through by osmosis and so draw the pigment out. If some are not fully submerged, then a lower concentration of pigment will leak out than if it was fully submerged.
Obtaining results
Table to show the temperatures that were aimed for and the actual temperatures that were used in the investigation.
Temperature (°C)
Aimed for temperature
Actual temperatures (taken at start and every 2 minutes)
Average actual temperature
0
.0
0.0
0.5
0.0
0.4
20
7.0
8.0
7.5
7.5
7.5
40
46.5
46.5
46.0
45.5
46.1
60
75.0
74.0
75.5
75.0
74.9
80
83.0
82.5
82.5
83.5
82.9
Table to show the colorimeter readings (what percentage of light was able to pass through) for the different samples of beetroot in the different temperatures.
Temperature (°C)
Colorimeter readings (%)
Average colorimeter reading (%)
0.4
54, 55, 52
53.7
7.5
70, 73, 57
66.7
46.1
43, 56, 45
48.0
74.9
5, 14, 17
5.3
82.9
9, 7, 8
8.0
= anomalous results
I will work out the standard deviation of my results. This enables me to analyse the reliability of my evidence. Standard deviation tells us how far a set of results deviates from the mean. The higher its standard deviation the more unreliable the results are. A standard deviation of between 0 and 1.5, would be considered as acceptable
To work out the standard deviation for a set of numbers, I first need to work out the mean of the numbers. I then need to find the deviation of each number, that is its difference from the mean and the sum of the deviations from the mean (the modulus of the differences, i.e. the positive value for the difference). After that, I need to square the deviation from the mean.
Colorimeter readings
Deviation (mean minus actual result)
Square of deviation
Sum of deviation squared
Standard deviation
54
0.3
0.09
4.67
V(4.67÷3) = 1.25
55
.3
.69
52
.7
2.89
70
3.3
0.89
44.67
V(144.67÷3) = 6.94
73
6.3
39.69
57
9.7
94.09
43
5
25
98
V(98÷3) = 5.72
56
8
64
45
3
9
5
0.3
0.09
4.67
V(4.67÷3) = 1.25
4
.3
.69
7
.7
2.89
9
2
V(2÷3) = 0.82
7
8
0
0
It is now possible to work out the standard deviation of my results from the values in this table, as the standard deviation is the square root of the sum of the differences from the mean, squared, divided by the number of pieces of data.
Standard deviation =
n = number of pieces of data
d = difference from mean
As you can see from the standard deviations that were obtained, most of my results were pretty accurate and so quite reliable. However, the colorimeter readings for the two temperature ranges of 20°C and 40°C, that had anomalous results, had very high standard deviations. This means that the results obtained for these values is not very reliable and so not very accurate.
From my graph you can see that the percentage transmission begins at a fairly low number, increases for a short period of time and then decreases for temperatures beyond 20°C. These results signal that my prediction was correct, that at around 0°C, the percentage transmission would be quite low, the percentage transmission would then increase to a certain point, but with temperatures above this point, the percentage transmission would decrease greatly. This is as at around 0°C, the phospholipid bilayer will freeze and the components within it will contract (become smaller in size), thus allowing the pigment to move out of the cell freely.
Also, the transport proteins within the bilayer will lose some of their specificity and so will allow molecules or ions (in this case the pigment) to pass through them with greater ease than under normal circumstances.
The cell surface membrane has become disrupted here and so the permeability of it has increased due to the disruption.
The increase in percentage transmission after that point and up to around 20°C was due to this being the approximate temperature that the beetroot would be in naturally. This would mean that the cell surface membranes would have been in their natural state and so the fluidity of the membrane would be as it should be. The transport proteins would have been working properly here as the bonds and attractive forces that are holding the protein together, so that it can work properly, are not disrupted. As well as that, the R-groups that line the transport proteins' channels, would all be correct and so would only allow certain molecules or ions to pass through.
At all the temperatures above this point, the percentage transmission decreased, meaning that more pigment leaked out of the cells into the distilled water. This is because with more heat energy (increase in temperature) there is more kinetic energy for the molecules that make up the cells. So, as the molecules that make up the phospholipid bilayer move, larger gaps are created between the phospholipids and other components of the bilayer. This enables the vesicles of betalains to pass through (diffuse) out of the cell, from a high concentration to a lower concentration, into the surrounding medium (distilled water).
The extra kinetic energy that is gained from the increasing heat energy, will also allow the pigment to move more and therefore more should diffuse into the surrounding environment of the cell. My results therefore support my prediction of what would happen.
As the temperatures rose past 70°C, the percentage transmission can be seen to drop very low. This is as the heat would be disrupting the cell membrane of the beetroot, the proteins within the membrane would become denatured as the bonds within the R-groups of the amino acids that make up the proteins, would break. This is because, with more heat energy, the molecules gain more kinetic energy and so move more. This extra energy is enough to break the bonds that are holding the R-groups together, so the precise 3D structure of the protein is altered, rendering them useless. The transport proteins lose their specificity; this allows molecules and ions, other than those that are supposed to be able to pass through them, to pass through with ease. Therefore, they no longer do their job of controlling what can leave and enter the cell; the pigment can thus diffuse freely out of the cell into the surrounding environment.
From this I can conclude that the permeability of the cell surface membrane is affected by the temperature of the environment that it is in. If the temperature falls too low, the cell membrane freezes and dies, so becoming more permeable. When the temperature rises above
the norm for the cell membrane, the fluidity of the cell membrane increases and so the permeability increases also. Although after a certain point, some or all of the components of the cell membrane may become denatured or die, which is why the permeability increases.
Evaluation
I think that on the whole my results were quite accurate and therefore quite reliable. This is as on the whole the results are fairly consistent with each other, on the most part the repeats were very close to that of the original results that was obtained and my results followed the trend that I predicted before I started investigation.
Table to show the sources of error within this investigation, how they affected the results and how they could be avoided or improved on.
Source of error
How this affects the results
How I could avoid/improve this
The volume of distilled water used in each case may not have been the same as a measuring cylinder was used.
This would mean that the concentration of the end solutions would have been greater than they should have been. If too more distilled water was put into some boiling tubes than others, then the solutions from these boiling tubes, would be more dilute and so more light would pas through them. The opposite would be true if less distilled water was put into some boiling tubes.
This accuracy of the measurement of the volumes of liquid could be increased by using graduated pipettes, which have a greater degree of accuracy. Therefore, the volume of distilled water used each time, should be as close to each other as possible.
There may have been some skin left on some of the beetroot samples.
As the skin of the beetroot is highly impermeable and therefore the pigment cannot leak out from areas which have skin on them, there would be less pigment leaking out from these samples with skin on them. This would account for any anomalies within my results that give a very low number compared to the other results in the same temperature range.
I would have to ensure that every piece of beetroot had no skin on them whatsoever. This would rule out this source of error.
The temperatures of the water bath fluctuated throughout the investigation.
This would mean that the fluidity of the cell membranes would change, if the temperature increased, the fluidity of the membrane would too increase and vice versa. An increased fluidity of the cell membrane would cause the membrane to be more permeable and so more pigment would leak out and once again, vice versa.
If I could obtain water baths whose temperatures did not fluctuate, this would avoid this error. However, the college does not have this facility.
Some of the pigment from the samples may have leaked out during the washing.
This would have meant that in some cases more pigment would have been able to have leaked out into the distilled water. This would have affected my results as some samples would have had less pigment leaking out than there could possibly have been.
To not wash the samples for a long period of time, and when drying them, to only pat them dry. Not squeeze them in any way, to ensure that no pigment is squeezed out.
The surface area of the samples would have decreased as they were touching the sides/bottom of the boiling tubes.
As the surface area of the samples were decreased by varying amounts, the concentration of pigment that was able to leak out via the cell membrane would have decreased for each of the temperatures that I investigated.
To avoid the surface area of the samples from being decreased, I could suspend the samples in the distilled water, so that maximum leakage could occur. This could be done by skewering the samples with a spike, then attaching the spike to something that could balance on top of the boiling tube.
None of the samples were exactly the same length; therefore the surface area of the samples differed.
Those that were slightly longer in length would have had a greater surface area and so more pigment would have been able to leak out than in their shorter counterparts. This is as the rate of diffusion is linked to the surface area available, the larger the surface area (given that the concentration of pigment is the same), the quicker the rate of diffusion.
To avoid this, I would have to use extremely accurate cutting equipment. However, the college does not have this, so I just have to try and ensure that the lengths of the samples are as similar to each other as possible. If the college did possess accurate equipment such as a micrometer, which is used to give accurate diameters and lengths of small objects, this would help to reduce this error greatly.
The cells within the different beetroot samples would have been different and so the permeability of the different samples would have differed.
Those samples that contained cells that had more permeable membranes would allow more pigment to leak out of them, even if all other possible variables were the same. Those with cells which have less permeable membranes would allow less pigment to leak out. However, there could also be a mixture of these types of cells within one sample.
There's not much that can be done in order to avoid this as it is impossible for me to be able to get samples that contain all of the same cells within them. However, in order to ensure that the cells are as similar as possible, I will take samples from the same part of the same beetroot.
When pouring the solutions into the cuvettes, condensation may have appeared on the sides of the cuvettes with solutions from the water baths.
The condensation that may have gathered on the sides of the cuvettes will affect my results as the condensation will cloud up the clear sides of the cuvettes. So a lower percentage of light will be able to pass through the sample compared to the same solution in a cuvette that has no condensation on its' sides.
To avoid this happening, I should wipe the sides of the cuvette with a paper towel to make sure that there is no condensation on the sides and so it cannot affect the colorimeter readings that will be obtained.
There may have been fingerprints on the sides of the cuvette that had no ridges.
Fingerprints on the sides of the cuvettes could have affected the colorimeter readings in the same way as condensation on the sides would have. They would have allowed less light to pass through the solutions and so a lower percentage of light would have been recorded as being able to pass through the sample.
To avoid this happening, I need to make sure to wipe the sides of the cuvettes in case any finger prints have gotten onto the cuvette. Also, I should try to avoid placing any fingers on the smooth sides of the cuvette as these are the sides that the light will pass through.
The needle on the colorimeter does not reach 100% and wavers over percentages.
This would affect my readings as the instrument that I am using in order to get my results is not very accurate. Also, it meant that I had to add values to my readings, to make up for the colorimeter not reaching 100. For example, if the colorimeter read 96% when I put a cuvette of distilled water in, to be read, I would have to add on 4 to every reading I got for my solutions. It was very hard to read the correct percentage off the scale as the needle wavered around.
To avoid this, I could use a colorimeter that read to 100% when distilled water was placed in, to be measured. However, the college does not have this equipment. What I could do instead is to take several readings and then take an average to try and get them as accurate as possible. If it were possible a digital colorimeter would be much more useful.
The beetroot samples were not all left in the distilled water for exactly the same amount of time, especially as I did my repeat tests at the same time. So, I was not able to put in/take them all out of the solutions at the same time.
This would have affected my results as some of the samples would have been left in the distilled water for longer and so the pigment within their cells would have had a longer period of time in which to leak out into the water. This would mean that for some the percentage transmission would be lower than it should really be.
To avoid this happening, I could do my repeats after I do the initial experiment on the first beetroot sample. This way, there is a greater likelihood of each samples being left in the distilled water for approximately the same amount of time.
I believe that the main source of error was the colorimeter itself; firstly, it was unable to remain on a constant percentage for very long, as it wavered over one or more percentages. As the colorimeter did not actually read to 100% light transmission even when distilled water was placed in, to be read, this shows that the instrument is inaccurate. Also I think that as many people were using the same colorimeter and spillages took place, it is possible that some water may have entered the colorimeter. This would have meant that the colorimeter became damaged in some way and so was not operating correctly, thus giving incorrect readings when used.
As the colorimeter did not read to 100%, that it was hard to read off the percentage transmission from the scale as the needle wavered and I had to read it off from a scale that did not have very high precision, that the colorimeter was the main source for my anomalous results. They may have occurred when the needle on the scale of the colorimeter wavered over several readings, stopped at one for a while before moving off. However, I may have read off the result when the needle stopped on a number for a short period of time. This would account for the anomalous result that was obtained.
If I were to repeat this investigation again, I would carry out even more repeats for each temperature, in order to get data that is as close together as possible. By repeating the experiments many times, the results obtained are more likely to be accurate and so reliable than. Most or even all of the results should be very close to one another, any that are not close are therefore anomalous and can be seen very clearly as they will not follow the pattern that the other results will have. By doing this, I will get lower standard deviations for all of my results, meaning that my results are more accurate than the ones that were obtained when only two repeats were carried out.
In every experiment there are uncertainties, which can occur. They are usually related to the precision of the equipment that is being used.
The percentage uncertainty (sometimes called error) can be calculated using the following equation:
Percentage uncertainty (error) = error x 100
reading
"Generally the limit of precision is taken to be half a division on either side of the smallest units on the scale you are using."1
The above statement is how you can work out the 'error' that is to be used in the equation for percentage uncertainty. The error is the difference in all the other possible readings, divided by two.
A stop watch can be read to 0.01 seconds. Therefore the end time reading can be:
0.01 ÷ 2
= ± 0.005 seconds
Percentage uncertainty of stop watch = 0.005 x 100
360
= 0.00139%
So there is a 0.0014% uncertainty with the timing on the stop watch. This is a very small figure, as it is so small it is safe to say that this piece of equipment is very precise.
The thermometer can be read to 0.5°C, therefore the end temperature reading can be:
0.5 ÷ 2
= ± 0.25g
Percentage uncertainty of thermometer = 0.25 x 100
46.1
= 0.5422%
The uncertainty of the thermometer is 0.542%.
A ruler can be used to measure to the nearest 0.05cm. So, the end measurement could be:
0.05 ÷ 2
= ± 0.025g
Percentage uncertainty of ruler = 0.025 x 100
2
= 1.250%
The uncertainty of the ruler is 1.250%.
A 10cm³ measuring cylinder can be used to measure to the nearest 0.5cm3. So, the end measurement could be:
0.5 ÷ 2
= ± 0.25g
Percentage uncertainty of measuring cylinder = 0.25 x 100
6
= 4.1667%
The uncertainty of the 10cm3 measuring cylinder is 4.167%.
The colorimeter could be used to read to the nearest 1%. Therefore, the reading could be:
÷ 2
= ± 0.5%
Percentage uncertainty of colorimeter = 0.5 x 100
53.7
= 0.9311%
The uncertainty of the 10cm3 measuring cylinder is 0.931%.
Most of these percentage uncertainties on their own are not very great and so it looks as if they would not affect my end reading much and so would not affect the calculated concentration of the acid much. However, once all of these percentage uncertainties have been combined, it is possible that they will have a great affect on the end reading that I obtained.
The validity of the results that I obtained will depend upon the accuracy of the equipment used. If there is an overall high uncertainty on the equipment used, then my results will not be as valid as they should or could be. Therefore, the points plotted on my results graph may be incorrect and so give a wrong impression of the affect that temperature has on the membrane stability of plant cell membranes.
Table to show percentage uncertainties of equipment used and total percentage uncertainty.
Equipment
Percentage uncertainty (%)
Stop-watch
0.0014
Thermometer
0.542
Ruler
.250
0cm3 measuring cylinder
4.167
Colorimeter
0.931
Total percentage uncertainty
6.891
The total percentage uncertainty of all of the equipment used is 6.89%. The percentage uncertainties are relatively low and so the accuracy and precision of the equipment used is quite high. This also means that the results that I obtained, which led to the plotting of the points on my graph, are quite precise.
However, I still need to look at the reliability of my results, as they can be precise without being accurate of reliable. Also, the equipment used could be exchanged for equipment that has a lower percentage uncertainty to ensure that the precision of results is as high as possible.
To extend this investigation further I could look at the affect of temperature on the permeability of other plant cells, such as potato cells, carrot cells etc. I could analyse the trends that occur in each of these plant cells and comparing them to one another.
I could also, do the same investigation again, only with a different set of temperatures, or more temperatures (e.g. 10, instead of 5). This would give me more data and so I would be able to see more clearly whether my results to this investigation were truly correct.
Bibliography
* Biology 1, Cambridge - used to find scientific knowledge in introduction and for Variables table.
* My Biology notes - used to find scientific knowledge in introduction.
* http://www-saps.plantsci.cam.ac.uk/records/rec82.htm - used to research information on pigments
* http://www.mrothery.co.uk/cells/resources/betacyanin.doc - used to research betalain
* http://www.scientisthq.com/_cbg/cbg_Article/?ArticleID=20 - used to research betalains further
* http://www.biosci.uga.edu/
* Statistics 1, MEI structured mathematics - to find the equation for standard deviation.
* The nature of Science, published by the Royal society for Chemistry, section 1
* Salters Advanced Chemistry 2000. Activities and assessment pack, second edition, publisher - Heinemann. Page 2.
Salters Advanced Chemistry 2000. Activities and assessment pack, second edition, publisher - Heinemann. Page 2.