Equipment list
- Test-tubes
- Thermometers
- Dropping pipettes
- Syringe
- Spotting tile
- Amylase solution
- Starch solution
- Iodine solution
- Measuring cylinder
- Stop clock
- Water baths
- Protective goggles
Health and safety issues
As with all laboratory-based experiments, the area in which the experiment will take place must remain safe at all times. Bags should be stored away from walkways, unused chairs placed under desks, and safety goggles must be worn at all times.
Variables
The experiment will be conducted using a temperature variant between 0oC and 70oC. However, in an effort to obtain a fair result, the entire experiment will be repeated three times. The following variables have been identified and where possible remain constant:
- Temperature of water
- Amount of iodine (always 1 drop)
- Amount of starch (always 9ml)
- Amount of amylase (always 1ml)
- Time of recordings (results will be recorded at strict 30 second intervals)
Based on the class size and the time restrictions at the time of the test, each pupil wasn’t able to produce three separate sets of results therefore, the results recorded by fellow pupils were obtained and used as part of the final evaluation. However, this was only after it was confirmed that they had carried out the same experiment under exactly the same conditions
Method
- Draw table to record results
- Put on safety goggles
-
Ensure all water baths have been set up and that the water in each has been heated to temperatures ranging between 0oC and 70oC
- Set out equipment in a manner that will allow a safe and successful experiment
- Place 1 drop of iodine onto each hollow on the spotting tile
- Draw up 1ml of amylase solution with the syringe
- Using a measuring cylinder, measure 9ml of starch and pour the contents of the cylinder into a test-tube
- Place the test-tube into one of the water baths and leave for approximately 1 minute or until the contents has reached the required temperature
- Once the starch is reaches the correct temperature, start the stop clock and immediately add the amylase solution to the starch (leave the test tube in the water bath to sustain a constant temperature)
- Agitate the contents of the test-tube with the syringe and after 30 seconds place one drop of the syringe contents onto the first hollow on the spotting tile and note the colour it turns the iodine solution (blue/black)
- Continue to agitate the starch/amylase solution and carry on placing single drops into the tile hollows at 30 second intervals
- Record the results based on weather or not you notice a change in the colour from it’s original state to brown/black
- Once you are satisfied that the solution has definitely changed colour you should then regard this an end point for the experiment
Note: You will find that the solution will not change colour at all temperatures. Therefore it is important to establish a suitable time scale where you can confidently state that no colour change can be expected. During this experiment the end point has been set at 600 seconds.
Results
The following table of results states the length of time it took for the amylase to work on the starch solution. As previously mentioned, some of my results were obtained via other pupils who had carried out the same experiment under exactly the same conditions.
* Results from my experiment ** Anomalous result omitted from averages
Analysis
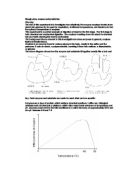
The graph shows that from the starting temperature of 0°C the graph line rose quite steadily until it reached 20°C where the line begins to rise much more considerably. But with temperatures over 40°C, the speed at which the amylase converted the starch to glucose began to slow down until after 60°C and above when the enzyme appeared to denature, thus stopping the reaction between itself and the starch.
Therefore I believe that at temperatures of 20oC to 40oC, the enzyme is in its most efficient state. However, between these points on the graph there is a curve, which indicates that the efficiency of the enzyme does not increase at a rate that is constant.
At temperatures between 40oC and 60oC, the efficiency of the enzyme decreases as the heat rises, which almost mirrors the first part of the graph.
The graph supports my prediction that the optimum temperature of the enzyme would be around 40oC, and would have decreasing efficiency towards 0oC, at which point the amylase would be unable to break down the starch at all.
The reason for this behaviour relates to the enzyme itself and kinetic theory. Kinetic theory is the idea that, when a substance is heated, its molecules, having been supplied with energy, move around faster. In this experiment, as the temperature increased, the enzyme and starch molecules collided more frequently and with more energy, which caused them to react more efficiently. At low temperatures, the molecules did not collide as frequently and the starch was therefore not broken down as quickly.
The enzyme was most effective at 40oC because this is body temperature, and is the temperature at which it is most used to working. In order for it to function efficiently in the body, amylase must have an optimum temperature of 40oC.
The reason why the amylase was less effective at higher temperatures was that it had started to denature. All enzymes start to denature at temperatures above their optimum temperatures, which renders them unable of catalysing reactions.
Test Evaluation
The experiment worked well overall, proving that the optimum temperature of the amylase used in the experiment was around 40oC. Despite the erratic nature of the experiment, the results were accurate enough to be aligned almost perfectly on a curve, and were taken at intervals far enough apart so that the readings were clearly distinguishable from each other.
However, the results were not totally accurate. For example, during test 1, when the experiment was carried out at 50oC, the solution changed colour in 180 seconds, whilst during tests 2 and 3 the enzyme took significantly longer to work. I have disregarded this particular result within test 1, as I feel it has been incorrectly recorded, possibility due to human error. This assumption can only be confirmed following completion of further tests at the same temperature.
In addition to the anomalous result, the chart clearly indicates slight differences between the results recorded by myself in comparison to that of the other two sets of test results. Although each student carried out the experiment in exactly the same fashion, the variations between results could be put down to the following factors.
- Water bath temperature – the temperature of the water appeared to fluctuate slightly throughout the experiment and didn’t constantly remain at the correct temperature
- Determining the colour change – it wasn’t always easy to determine weather or not the solution had made the transition between blue/black and brown/black. This was mainly due to the colour similarities and that the colour didn’t always make an immediate change
- The speed in which the amylase/starch solution was transferred between the water bath and the spotting tile
In an effort to ensure accurate results are constantly obtained, an ideal solution would have been to automate the entire process, with a sample of the mixture being automatically added to the iodine whilst keeping the solution at an unchanged temperature. This would also overcome the inaccuracies relative to the timing of the experiment, which will rarely be exact if an individual is expected to monitor the stop clock and give perfect results.
Overall the accuracy of the results are good enough to give a sensible conclusion. However, if the experiment had been conducted under more strict conditions and with more advanced instruments, the conclusion would not have been different although the individual test results might have been more accurate and the graph might have looked slightly different.