I will then:
· · Plot a graph of rate against (average) substrate concentration and compare it with the prediction.
· · Calculate the amount of enzyme present and compare this with the prediction.
· · Calculate the Michaelis constant (KM) for catalase.
· · Decide whether the Q10 Formula is accurate for catalase.
· · Plot a graph of rate against concentration with all the repeats and the averages on and determine from the line of best fit which results were anomalous.
· · Decide what factor might have caused the anomalies
There are many variables that affect the results and a fluctuation of any of those that I am controlling will result in incorrect, biased or anomalous results.
The factors that are most likely to cause inaccuracies are:
· · The accuracy to which I can dilute the hydrogen peroxide, including; drips, pipettes leaving different amounts in the tip, parallax error (minimal), gradual breakdown of the hydrogen peroxide and impurities in the beaker including water (after being washed out).
· · The accuracy to which I can control the surface area of potato exposed to the hydrogen peroxide including; the accuracy of the scales, water on the potato cylinders, the temperature in the room (the borer expands with a rise in temperature, affecting the size of the cylinders), although only a minor consideration, the way in which I trim the cylinders to have the same weight and the density of the potatoes (which could change due to incipient plasmolysis).
· · Fluctuations in the precise set-up of the apparatus, including the depth of the water in the ice-cream tub (against which affects the pressure which the oxygen has to push), the relative heights of the beaker and the bottom of the burette and the air pressure on the day.
· · The accuracy of the measurements including; the time lapse between seeing a bubble get to the surface of the water in the burette and stopping the stop clock and the size of the bubble (a large one could mean a jump from too little air in the burette to too much air, resulting in the timing being out).
· · The accuracy to which I can measure the temperature, the time lapse between finishing the reaction and taking the measurement possibly being significant because the reaction is endothermic and the hydrogen peroxide is kept in the fridge, therefore the solution will get warmer the longer one leaves it until it is at room temperature. The thermometers to which I will have access are also not very accurate.
In this section I have given the reasons for any modifications on the original plan that were necessary during the execution of the experiment.
· · I had originally planned to use 20 ml of catalase solution. I found that this was too slow and therefore the inaccuracies would be magnified and the results vary greatly for the lower concentrations. I therefore increased to 30 ml.
· · I found that some of the results were out, so I decided to leave out the experiments at 2.5% and 7.5%, and repeat the experiments for the one that was out (i.e. 12.5%).
· · This still gave me a fairly large range, and the extra repetition helped to define the trend in places where it was not so clear.
· · When setting the apparatus up, I found that the rubber parts of the pipette could be used to suck water up the burette. This meant that the set up could be left exactly as it was and only the flask had to be removed from the set up to rinse out.
· · I also left the apparatus set up when I had finished, and used the same retort stand with everything already on it each lesson, which saved time and reduced inaccuracies.
· · I found that collecting 20 ml instead of the originally planned 50 still gave me fairly low percentage errors, and reduced errors caused by the natural curve of a reaction causing times to be exaggerated at lower concentrations.
· · I had 2 retort stands set up, which saved time and let me do some shorter reactions whilst a longer one was going on.
I think that the errors which affected my results, in order of importance, were:
· · The accuracy to which I could dilute the hydrogen peroxide, including drips, pipettes leaving different amounts in the tip, parallax error (minimal), gradual breakdown of the hydrogen peroxide when I used a solution a few days after I made it because I ran out of time, and impurities in the beaker including water (after the beaker was washed out).
· · The accuracy to which I could control the surface area of potato exposed to the hydrogen peroxide.
· · Fluctuations in the precise set-up of the apparatus, including the depth of the water in the ice-cream tub (which affects the pressure which the oxygen has to push against), the relative heights of the beaker and the bottom of the burette and the air pressure on the day. I think that using two experiments set up at once (obviously can’t be identical) was a major cause of this error. This could have been the primary cause for the fluctuations at 12.5% and 15%.
· · The accuracy of the measurements including; the time lapse between seeing a bubble get to the surface of the water in the burette and stopping the stop clock and the size of the bubble .
· · The accuracy to which I can measure the temperature, the time lapse between finishing the reaction and taking the measurement possibly being significant because the reaction is endothermic and the hydrogen peroxide is kept in the fridge, therefore the solution will get warmer the longer one leaves it until it is at room temperature. The thermometers to which I will have access are also not very accurate.
Then the sheet on which I put the information to be transferred to graphs.
Then come the graphs in a numbered order. They need no explanation as they have complete headings.
The computer plotted the lines of best fit and some are more roughly sketched than others are.
I found that the general trend was indeed a Michaelis-Menten curve. The rate remained directly proportional to the substrate concentration at low concentrations, the straight line only curving slightly at 17.5%.
The shape of the curve followed the same pattern as shown in the prediction. I therefore have assumed that the formula that I used in the prediction is correct for this investigation. Because the highest concentration that I used was at 20%, only the first part of the graph was produced by my results.
I have found that the predicted values where fairly similar to the results that I got. For example:
Prediction Calculation
Rate 0.05ml/s 0.049ml/s
KM 5E-8 5.64E-8
Enzyme 1.2E6 1.24E6
I therefore concluded that the formula applied to this reaction.
Further proof that the graph that the results produced was not just a fluke, caused by the fluctuation in conditions throughout the investigation, is the graph that I made of the individual reaction. This shows a perfect model of a Michaelis-Menten curve. I therefore consider my hypothesis proven.
My explanation for the results is as follows: because of the increased chance of a successful collision caused by random thermal motion when there are more molecules present, there is an increase in rate with higher substrate concentration. For low concentrations the rate of the reaction is therefore directly proportional to the concentration of hydrogen peroxide in the solution. This is because if double the amounts of substrate molecules are in the solution, double the amount will find an enzyme molecule at the same time if all the substrate molecules are moving at similar speeds (the average speed being directly proportional to the temperature). Therefore if there are double the amount of substrate molecules in a solution, double the amount of reactions will take place at once and the rate will be doubled. Because of the time taken for the reaction and dissociation of the enzyme-product complex, as the concentrations of substrate increase not all the collisions of the substrate are successful because some active sites will be saturated (occupied by substrate/products).
The frequency of this occurrence increases with the substrate concentration, and eventually the terms cancel out, leading to no rate increase with substrate concentration increase at high concentrations. This is because as the rate increases this must mean that more enzyme molecules are reacting with the substrate at one time, seeing that the reaction and dislocation time is constant at constant temperature, causing more substrate-enzyme collisions to be unsuccessful due to saturation.
I also found that either the Q 10 formula itself, or the way in which I applied it, did not work in this case. This was a disappointment because I recorded a fairly large range of temperatures.
This is an evaluation of the assumptions that I have made been my conclusion and the viability of the results on which it was based.
The main weak point with my conclusion is that there is only one set of data that accurately supports it. The conclusion is based mostly on rate 1, which is derived from the oxygen produced in five minutes. I have also assumed that the result at 12.5% is an anomalous result. The grounds for the assumption are sound (I had left the solution for a few days and I was using the second set of apparatus, which will obviously not be identical to the first) but it may not be the case. The science on which the prediction is based, however, seems sound to me although I don't I doubt that there are complications which I haven't thought of yet. It is therefore feasible that the Q 10 formula worked and that the other set of results is correct. But I couldn't come up with an explanation nor find one from anywhere else. I am therefore sticking by my assumption my prediction was correct. This seems the most reasonable because it abides with the normal laws of science.
The anomalies which I found where either formed when I temperature balanced the results or from the set of results that I got when I collected 20 ml at each concentration (rate 2). If I take these into account buyer have a very strange pattern which fire he cannot explain. They seem to generally show a trend of regular increase in the effect of substrate concentration on the rate of the reaction. In other words, the graph curves up before starting to plateau out. The only assumption one can make is that the quality of the results is variable and therefore only the general trend can be taken into account, which brings us back to approximate proportionality. It is therefore impossible to include the results which I have classed as anomalous in it the conclusion because I can't work out any explanation for the trend or at indeed find a scientific reason for the type of increase demonstrated.
In this experiment I will attempt to investigate the factors that effect the rate of reaction of the enzyme catalase.
Catalyse is an enzyme found in food such as potato and liver. It is used for removing Hydrogen Peroxide from the cells. Catalyse speeds up the decomposition of Hydrogen Peroxide into water and oxygen. It is able to speed up the decomposition of Hydrogen Peroxide because of the shape of the Hydrogen Peroxide molecule. This type of reaction where a molecule is broken down into smaller pieces is called an anabolic reaction.
Catalyse
2H₂O₂ 2H₂O + O₂
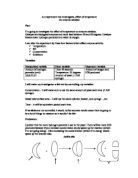
Enzymes are proteins that act as catalysts. They are made in cells. A catalyst is something that speeds up a reaction, but does not get used up in the reaction. One can usually be used many times. An example of this is shown in the following diagram:
Prediction
I predict, that if I have a higher enzyme concentration, then this will cause a higher rate of catalyse activity, because there will be more active places for a reaction to take place, which will cause more chemical reactions because of successful collisions because of the active site of the enzyme and substrate.
Apparatus
· Hydrogen peroxide (H₂O₂)
· Water (H₂O)
· Bung
· Conical flask x2
· Delivery tube
· Measuring cylinder 150ml
· Potato
· Stop watch
Diagram
Method
First of all, I will get all my equipment out and ready, as shown in the diagram, making sure my work surface and apparatus are completely clean, and ready for the experiment.
Next, I will cut a potato into 6 equal (3 cm) cylinders, and keep them ready. Then, I will put 10cm₃ of hydrogen peroxide into a conical flask, and immediately put the bung with the delivery tube in it on the conical flask, so oxygen does not escape. Then, I will put 150cm₃ of water into the other conical flask. I will then take the bung off the conical flask with the H₂O₂ in it, put one of the 5 potatoes into the H₂O₂, and quickly put the bung back on, and put the other end of the delivery tube into the conical flask containing the H₂O. I will then immediately start the stop watch.
Then, I will count the number of bubbles that come through the delivery tube, and out of the water in a time limit of 5 minutes.
Then, I will do the experiment using 20 CM₃ of H₂O₂, then 40, then 50, etc…
To keep it a fair test, I will do the experiment at room temperature. I will also measure out all the chemicals at eye level, and I will keep the amount of water used constant (150 cm₃) throughout the whole experiment. The time will also be kept constant at 5 minutes for each experiment. The equipment must be cleaned and dried after each experiment to keep it a fair test.
Results
Results 1st time
Results 2nd time
Average No. of bubbles
Conclusion
In conclusion, I have found that my prediction was correct. The higher the enzyme concentration was, the more oxygen was produced, or in the case of my experiment, more bubbles were produced.
This is because the higher the enzyme concentration, the more active sites there are where a collision between an enzyme and the substrate can take place.
As you can see in the graph, the amount of bubbles increases as the amount of enzyme concentration decreases. This indicates that it was reaching the optimum state of catalyse activity.
Evaluation
My experiment has gone quite well, but I could do certain things in order to get more accurate results. Firstly, if I had time, I would certainly do the experiment more times, as this would give me a more precise average.
Also, I would have done the experiment with a piece of liver too, just to make sure that the catalyse activity is the same in the liver as the potato. Although, I already know from what I have been taught, that the liver would give similar results to the potato.
Another thing I would have done is use a pureed potato instead of using a potato cylinder like I did. This is because it would give more active sites for a reaction to take place.
According to the graph, there are no visible outstanding results. However, if I had done the experiment more times and got a more precise average, then there may have been a few outstanding results. (By outstanding results I mean results that do not fit in with the other results, for example they may be too high or too low).
Amylase
The Effect Or Varying Enzyme Concentration On The Breakdown Of Hydrogen Peroxide In The Presence of
[ []
Hypothesis – Hydrogen peroxide will breakdown to oxygen and water in the presence of Catalase. The reaction will increase with increasing enzyme concentration when molecules of hydrogen peroxide are freely available. However, when molecules of the substrate are in short supply, the increase in rate of reaction is limited and will have little effect.
Variables – In this investigation, the variables that affect the activity of the enzyme, Catalase, were considered and controlled so that they would not disrupt the success of the experiment.
i) Temperature – As temperature increases, molecules move faster (kinetic theory). In an enzyme catalysed reaction, such as the decomposition of hydrogen peroxide, this increases the rate at which the enzyme and substrate molecules meet and therefore the rate at which the products are formed. As the temperature continues to rise, however, the hydrogen and ionic bonds, which hold the enzyme molecules in shape, are broken. If the molecular structure is disrupted, the enzyme ceases to function as the active site no longer accommodates the substrate. The enzyme is denatured.
To control this variable, the temperature was maintained at a fairly constant level that allowed the enzyme to work effectively (room temperature, approximately 23°C). This was achieved by using a test tube rack and tongs to handle the apparatus so that the heat from my hands did not affect the Catalase.
ii) pH – Any change in pH affects the ionic and hydrogen bonding in an enzyme and so alters it shape. Each enzyme has an optimum pH at which its active site best fits the substrate. Variation either side of pH results in denaturation of the enzyme and a slower rate of reaction.
In this experiment, the pH was kept constant using a pH 7 buffer, selected to maintain a pH level suited to the enzyme by being equal to the natural environment of the enzyme (potato tissue).
iii) Substrate Concentration – When there is an excess of enzyme molecules, an increase in the substrate concentration, produces a corresponding increase in the rate of reaction. If there are sufficient substrate molecules to occupy all of the enzymes’ active sites, the rate of reaction is unaffected by further increases in substrate concentration as the enzymes are unable to break down the greater quantity of substrate.
To control the substrate concentration, identical quantities of the substrate were used for each reading. To ensure that this was measured precisely, 5ml syringes were used to accurately gauge to exact quantities.
iv) Inhibition – Inhibitors compete with the substrate for the active sites of the enzyme (competitive inhibitors) or attach themselves to the enzyme, altering the shape of the active site so that the substrate is unable to occupy it and the enzyme cannot function (non-competitive inhibitors). Inhibitors therefore slow the rate of reaction. They should not have affected this investigation, however, as none were added.
v) Enzyme cofactors – cofactors are none protein substances which influence the functioning of enzymes. They include activators that are essential for the activation of some enzymes. Coenzymes also influence the functioning of enzymes although are not bonded to the enzyme.
Unless enzyme cofactors were present in the potato tissue containing the Catalase, they were not included in this investigation and therefore would not have affected the rate of reaction and the results of this experiment.
vi) Enzyme Concentration – Provided there is an excess substrate, an increase in enzyme concentration will lead to a corresponding increase in rate of reaction. Where the substrate is in short supply (i.e. it is limiting) an increase in enzyme concentration has no effect.
I varied the enzyme concentration by altering the number of equal sized discs of potato that contain the Catalase, in the reaction. The greater the number of discs, the greater the enzyme concentration.
Apparatus –
Procedures – Three tubes, 10mm in diameter were bored from a potato using a cork borer. Using a razor blade and a ruler, 122 discs, 1mm thick, were cut from the tubes and placed under distilled water in a petri dish. This prevented the potato from being contaminated or dehydrated.
5ml of hydrogen peroxide and 5ml of a pH 7 buffer were then measured and added to each of six boiling tubes using a syringe. Care was taken to view the syringes from the side to ensure the bottom of the meniscus was lined up properly with the gradations and there were no air bubbles in the syringe. A pH buffer was added to the boiling tubes to maintain the pH at a constant level so that changes in pH as a result of the reaction would not affect the activity of the enzyme and disrupt the results. pH 7 buffer was selected to match the natural pH of the potato tissue and therefore suit the enzyme so that it could work efficiently.
One of the boiling tubes was then connected to a manometer containing manometer fluid using a bung (see diagram below). Holding the manometer level by the bung to ensure that the fluid was at its lowest level, a mark was drawn to indicate this point using a marker pen. A further mark was then drawn 5cm above the original, measured using a ruler.
15 pieces of potato were placed in to the boiling tube using a pair of tweezers to prevent contamination. A clamp was then placed over the rubber tubing on the bung to ensure that all of the oxygen gas released will travel up the manometer tube and not escape. Once the clamp was closed, the stopwatch was started to record the time taken for the manometer fluid to travel to the second mark. When this had been achieved the time was noted in a results table and the clamp opened to allow the gas to be released and the manometer fluid to return to its original level. Once the apparatus had been reset and any air bubbles in the manometer fluid removed, a second and later third reading was taken by re-closing the clamp and measuring the time taken for sufficient gas to be released from the reaction to force the manometer fluid back up to the top mark. By taking several readings for each enzyme concentration, it enabled me to average the results to minimise the extent of any inaccuracies. The experiment was then repeated for different quantities of potato discs (enzyme concentration) by using different boiling tubes containing hydrogen peroxide (see table below for quantities). I began with an enzyme concentration of 15 potato discs rather than a lower quantity to ensure that the apparatus was working correctly.
Observations and Measurements – In the boiling tubes it was clear that a reaction was taking place by the observation of bubbles of oxygen gas being released creating a ‘fizzing’ in the boiling tubes.
In order to decide how varying the enzyme concentration affected the decomposition of hydrogen peroxide, the rate of reaction was measured. To do this accurately, the time taken for a specific quantity of oxygen gas (a product of the reaction) to be released was determined. This was achieved by observing the time taken for the manometer fluid to travel between the two marked fixed points as it was forced through the manometer by the rising gas. This was an accurate measure of how the enzyme concentration influenced the breakdown of hydrogen peroxide, as the quantity and speed of gas produced is dependant on the rate of reaction. The marked points remained the same distance apart for each reading for different enzyme concentrations so that they could be accurately compared and the trend observed.
All measurements were taken so that the stopwatch was started once the rubber tubing was sealed and the stopwatch stopped once the manometer fluid had reached the base of the highest marked point. To judge accurately, the point at which the fluid reached the marked line, it was examined at eye level and the measurement taken when the bottom of the meniscus was lined up to the mark. This was the same for every reading.
Data handling – The data obtained from this investigation has been recorded in a table showing the time, enzyme concentration and rate of reaction. This means that the results of the experiment are presented in a clear and orderly fashion that allows patterns in the results to become more obvious.
The rate of reaction was calculated by dividing 1000 by the time taken for the quantity of gas to be produced from the reaction. By calculating the rate of reaction instead of merely using the time readings, the quicker reactions will be represented as a greater value for the rate of reaction rather than a small time value. This makes the graph more clear and easier to analyse.
Patterns within the results collected from the experiment, are best shown on a graph. This is because overall trends between the enzyme concentration and rate of reaction can be portrayed more effectively and become more obvious.
Limitations and Precautions – In this investigation, I measured the rate of reaction with enzyme concentrations of between 0 and 35 units (potato discs). At 0, there should be no reaction as there will be no substrate, however, I included it to act as a control. This will show that it is the variable, enzyme concentration that is being measured.
I decided to vary the enzyme concentration by varying the number of potato discs. However, although the enzyme, Catalase, occurs in the potato tissue, I did not know the exact quantity and certain discs might have more Catalase than others. This could be a major limitation in this investigation. I have tried to compensate for this, however, by taking multiple readings for each enzyme concentration so that inaccuracies are minimised once averaged.
As a precaution, I have limited my contact with the boiling tubes, as my body heat will raise the temperature, increasing the rate of reaction or expanding the gas inside the test tube moving the manometer fluid.
I also monitored the temperature using a thermometer to ensure that it remained constant and not disrupt the results of the experiment by affecting the activity of the Catalase.
A pH buffer was used to maintain a consistent pH level in the boiling tubes. This way there was no variation in pH that might have resulted in an increase or decrease in the rate of reaction.
A major limitation of this investigation was the time. It meant that only 8different enzyme concentrations could be measured at intervals of 5 units or potato discs. This means that only very general, overall trends can be identified across the results. Patterns between these values can only be approximated and are not necessarily accurate.
Safety – Laboratory coats were worn during the investigation to prevent chemicals from spoiling clothes. Care was also taken whilst handling the chemicals as hydrogen peroxide is corrosive and the manometer fluid is permanently staining. Whilst using the razor blades, care was also taken to hold them by the handle and not the blade to prevent an accident occurring.
Results – The rate at which hydrogen peroxide was broken down to water and oxygen in the presence of Catalase:
The graph “The decomposition of hydrogen peroxide in the presence of potato catalase Chart 2” shows the rate of reaction up to an enzyme concentration of 25. Up to this point the line of best fit is a straight line through the origin. This shows that without the enzyme, catalase, present no reaction takes place. It also indicates that the enzyme concentration is directly proportional to the rate of reaction for the decomposition of hydrogen peroxide in the presence of catalase (the rate of reaction increases with increasing enzyme concentration).
The other graph, “The activity of potato catalase with differing enzyme concentrations Chart 1”, shows how the rate of reaction varies with differing enzyme concentrations over the whole range that I experimented with. After an enzyme concentration of 25 potato discs, the line of best fit is no longer a straight line and begins to level off. The enzyme concentration is no longer proportional to the rate of reaction, and the increases in the rate of reaction reduce dramatically.
Conclusion – The reaction was fastest at an enzyme concentration of 35 potato discs. At this enzyme concentration there were the greatest number of free active sites available to the substrate molecules so that they could be broken down.
The rate increased steadily from 0 up to a concentration of 25 and slowed beyond this point to give a “maximum level”. It appears that at this “maximum level”, increasing the enzyme concentration had little effect and other factors such as substrate concentration were limiting the reaction and prevented any further increases in the rate of reaction.
Discussion – The results of this investigation are as I predicted in the hypothesis: “The reaction will increase with increasing enzyme concentration when molecules of hydrogen peroxide are freely available. However, when molecules of the substrate are in short supply, the increase in rate of reaction is limited and will have little effect”. The reasons for this are that there are number of variables that influence the decomposition of hydrogen peroxide in the presence of Catalase. Some of which can be classified as limiting factors i.e. the reaction is dependant or “limited” by their availability, to be able to function effectively; these include enzyme concentration, temperature and substrate concentration. All of these factors are required for an efficient reaction to take place, even when one is freely available the reaction can still be limited by the availability of the others. When I increased the enzyme concentration, it meant that there were more free active sites for the substrate molecules so that a greater quantity of substrate molecules could be broken down into products. However past a certain point, which in my investigation was at an enzyme concentration of 25 potato discs, there were many free active sites but insufficient substrate molecules to occupy them. Increasing the enzyme concentration further without increasing the substrate concentration has no effect on the rate of reaction which eventually will remain constant.
From the line of best fit on the graph “Chart 1”, it is clear that some of the points do not exactly fit. They are anomalies. Although they have only slight inaccuracies, they are an indicator of possible errors in the investigation. These may have occurred in either the measurement of the quantities of the enzyme and substrate or the measurement of the time taken for the manometer fluid to rise five centimetres up the manometer tube. Another possibility was that fluctuations in temperature caused the rate of reaction to increase or the gas inside the boiling tube to expand, forcing the fluid to rise up the manometer tube. Although minimal contact was made with the apparatus during the investigation, slight undetected variations in the room temperature may have led to inaccuracies.
The precision of this experiment, generally, was very limited since insufficient readings were taken. Although the range of enzyme concentrations taken was large, the difference in enzyme concentration between each reading was too great to distinguish a value between them. For example, the rate of reaction at an enzyme concentration of 15 potato discs was 35 + or – 4. This results in an error of uncertainty of 11%
The shape of the graph is as I predicted showing that as enzyme concentration increases so does the rate of reaction. This is because at a greater enzyme concentration, there are more free active sites available for the substrate and so more products can be made in a shorter length of time. However, it is not possible to take precise readings from the graph between the plotted points since insufficient readings were taken. To be able to do this, intermediate enzyme concentrations would have to be measured so that the shape of the graph would be more exact.
Suggestions and Improvements - To create a more accurate experiment in the future, several precautions or alterations can be made:
· Instead of using potato discs that have slight variations in size, and volume of catalase, as a source for the enzyme, a 1 molar solution of the enzyme could have been diluted to create different concentrations. This way the concentrations can be measured far more accurately reducing the chances of errors in the investigation.
· In this experiment 8 enzyme concentrations were considered. However, although there was a large range, insufficient intermediate measurements were made creating gaps between the measurements where guess work is needed to predict the rate of reaction at these points e.g. point A on graph “Chart 2”. In a future investigation, a far greater number of enzyme concentrations between those already recorded should be tested reducing the extent of any anomalies on a graph where the line of best fit must be drawn.
· In this investigation each reading was repeated so that an average rate of reaction for each enzyme concentration could be calculated. This could be improved by repeating the reading more frequently thus reducing the extent of any anomalies further, once averaged.
The Optimum Conditions For The Enzyme Sucrase
[Save this essay for later viewing] [View Saved Essays]
Hypothesis – The digestion of sucrose into glucose and fructose is carried out by the presence of the enzyme Sucrase. The activity of the enzyme will be greatest at its optimum temperature since at this temperature the enzyme’s tertiary structure will be correct to allow the formation of the substrate-enzyme complex quickly and efficiently. This should be at 37°C (body temperature) which is the temperature of the ileum where Sucrase is secreted and naturally functions.
Variables – In order to create a fair test, I considered the variables that affect the activity of the enzyme, sucrase. Any variables that were likely to disrupt the results were controlled, and the variables being investigated were varied accurately so that their effect could be measured precisely.
i) Temperature – As temperature increases, molecules move faster (kinetic theory). In an enzyme catalysed reaction, such as the digestion of sucrose into glucose and fructose, this increases the rate at which the enzyme and substrate molecules meet and therefore the rate at which the products are formed. As the temperature continues to rise, however, the hydrogen and ionic bonds, which hold the enzyme molecules in shape, are broken. If the molecular structure is disrupted, the enzyme ceases to function as the active site no longer accommodates the substrate. The enzyme is denatured.
To control this variable and vary it accurately, water baths were used to maintain the temperature of the enzyme at set intervals to obtain an accurate range of temperatures. This ensured that the temperatures of the enzyme and substrate molecules were kept constant so that results were more accurate. When the test tubes containing the enzyme molecules had to be removed from the water baths to carry out measurements, this was done quickly and they were transferred into a test tube rack. They were removed from the water baths for the shortest time period possible. These measures helped to ensure that a constant temperature was maintained and that heat from the surrounding environment or hand contact was minimised enabling a more consistent temperature to be maintained whilst readings were being taken.
ii) pH – Any change in pH affects the ionic and hydrogen bonding in an enzyme and so alters it shape. Each enzyme has an optimum pH at which its active site best fits the substrate. Variation either side of pH results in denaturation of the enzyme and a slower rate of reaction.
In this experiment, the effect of temperature was being measured; the pH was kept constant and the formation of products during the reaction should not have affected the pH inside the test tube. The pH should only have changed when the sulphuric acid was added. At this point, the time allowed for the reaction has ended and readings were taken. The amount and time this acid was added was kept constant for each reading and so will not affect the accuracy of the results.
iii) Substrate Concentration – When there is an excess of enzyme molecules, an increase in the substrate concentration, produces a corresponding increase in the rate of reaction. If there are sufficient substrate molecules to occupy all of the enzymes’ active sites, the rate of reaction is unaffected by further increases in substrate concentration as the enzymes are unable to break down the greater quantity of substrate any quicker.
To control the substrate concentration, identical quantities of the substrate were used for each reading. Each measurement of substrate were taken form the same source and concentration (10%). To ensure that the quantity of substrate was measured precisely, a measuring cylinder was used to accurately gauge the exact quantities.
iv) Inhibition – Inhibitors compete with the substrate for the active sites of the enzyme (competitive inhibitors) or attach themselves to the enzyme, altering the shape of the active site so that the substrate is unable to occupy it and the enzyme cannot function (non-competitive inhibitors). Inhibitors therefore slow the rate of reaction. They should not have affected this investigation, as none were added.
v) Enzyme cofactors – cofactors are none protein substances which influence the functioning of enzymes. They include activators that are essential for the activation of some enzymes. Coenzymes also influence the functioning of enzymes although are not bonded to the enzyme.
In this investigation the presence of cofactors should not affect the results of the investigation as, unless they were naturally present from the sucrase source, none were added.
vi) Enzyme Concentration – Provided there is an excess substrate, an increase in enzyme concentration will lead to a corresponding increase in rate of reaction. Where the substrate is in short supply (i.e. it is limiting) an increase in enzyme concentration has no effect.
In this investigation the enzyme concentration will be kept constant by using an equal concentration and quanity for each reading. The volume of enzyme was measured accurately by using a 1ml syringe to measure out a 1 % solution of the sucrase.
vii) Volume of Potassium Permanganate – In this investigation the time taken for the loss of colour from a solution of acidified potassium manganate (vii) was used as a measure of the amount of glucose produced from the hydrolysis of sucrose. The volume of acidified potassium manganate (vii) had to be kept constant as a larger volume may take longer to decolourise whether or not less glucose has been produced. Therefore identical quantities of acidified potassium manganate (vii) were used for each reading in the investigation measured accurately using a 5ml syringe.
Apparatus –
i) 250mls Sucrose solution (10%)
ii) 20mls Sucrase solution (1%)
iii) 120mls sulphuric acid (1M)
iv) 60mls Potassium Permanganate (0.01M)
v) 50 ml measuring cylinder
vi) Marker pen
vii) Boiling tube rack
viii) 10 boiling tubes
ix) 2 Stopwatches
x) 1 1ml syringe
xi) 1 2ml syringes
xii) 2 5ml syringes
xiii) 2 10ml syringes
xiv) 250ml Beaker
xv) Bunsen Burner
xvi) Tripod
xvii) Gauze
xviii) Glass rod
xix) Thermometer
xx)
Procedures –
Four waterbaths were set up so that they contained water at the constant temperatures of 30°C, 35°C, 40°C and 45°C and the room temperature was measured as 22°C using a thermometer. By using waterbaths, the temperature could be kept constant and monitored closely so that the effect of varying temperature could be measured accurately.
A Bunsen burner was lit and placed under a tripod and gauze so that it could heat an additional beaker containing water to act as another waterbath that could be heated to different temperatures as required. This meant that the activity of sucrase could be measured at a greater range of temperatures so that more accurate conclusions could be drawn from the investigation.
For each temperature, 19cm3 of sucrose solution was measured using a measuring cylinder and placed in a boiling tube. The marker pen was used to label the boiling tube with my initials and the temperature. The boiling tube was then put into a water bath (or for room temperature, placed in the boiling tube rack) and left for 5 minutes to equilibrate. This meant that the sucrose solution had sufficient time to ensure that all of the solution was raised to a constant desired temperature.
1cm3 of sucrase solution was carefully measured using a 1ml syringe, and after five minutes was added to the sucrose, the stopwatch was started and the solution was stirred using a glass rod. By stirring the mixture, it ensured that the enzyme was adequately mixed with the substrate so that it could function effectively. After exactly ten minutes, the boiling tube was removed from the water bath and placed in the boiling tube rack. The ten minutes had to be measured precisely as this time affects the amount of sucrose broken down into glucose and fructose and therefore the results of the investigation. The amount of glucose was measured by adding 10cm3 of sulphuric acid (measured using a 10ml syringe) and 5cm3 of potassium permanganate (measured using a 5ml syringe). A stopwatch was used to record the time taken for the solution to go clear. To ensure an accurate estimation of the end point, a boiling tube filled with distilled water was placed next to the boiling tube containing the acidified potassium manganate in the boiling tube rack, so that they could be compared and the end point determined.
The experiment was repeated twice for each temperature reading and carried out over ten different temperatures. This ensured an adequate range of results that could be averaged to minimise the effect of any anomalies.
A control was carried out in this investigation to ensure that it was the presence of the enzyme sucrase alone, that was breaking down sucrose to glucose and fructose and that only the effect of temperature was being measured. This was achieved by carrying out the experiment described above for a temperature of 35°C but substituting the normal enzyme for 1cm3 of sucrase solution that had been boiled. By boiling, the enzyme is denatured and cannot function because the heat had disrupted the tertiary and quaternary structure that helps to form the active site, but still possesses the same chemical characteristics. This meant that if the test for glucose proved negative, then sucrose could not be digested without the presence of the active enzyme sucrase and that it was only the effect of temperature on the enzyme that was being measured in this investigation.
Observations and Measurements –
In this investigation measurements of reacting quantities were measured using syringes. The size of syringe was selected to give the most accurate reading i.e. smaller syringes were used for smaller quantities. This meant that the scales on the apparatus allowed a more accurate determination of the exact quantity. When a measuring cylinder was used, care was taken to accurately align the base of the meniscus with the graduations on the scale.
The digestion of sucrose produces glucose and fructose. Glucose is a reducing sugar and will reduce an acidified purple-pink solution of potassium manganate (vii) (potassium permanganate) to a colourless solution of manganese (II) ions.
Mn4- + 8H+ + Se- ® Mn2+ + 4H2O
Purple-pink Colourless in
Solution Solution
When the acidified potassium manganate solution was added to the enzyme–substrate solution, the result was a purple solution. As the enzyme, sucrase hydrolysed the sucrose, the potassium permanganate became reduced and a colour change was observed where the solution became colourless.
In this investigation, the time taken for acidified potassium manganate to decolorise was measured. This was achieved by placing a boiling tube containing distilled water next to the tube containing the purple solution. The time taken for this solution to decolorise was measured by comparing the tubes to accurately determine the end point.
Data handling –
The data obtained from this investigation was a series of times for the acidified potassium manganate solution to decolourise in varying temperatures. The average of the two readings for each variation of pH and temperature was taken. This decreased the extent of any anomalies in the investigation and therefore created fairer results that can be interpreted more accurately. In order to analyse the results to find the optimum temperature and pH for the enzyme substrate, they must be evaluated to find the rate of reaction in each of the conditions. A measure for the rate of reaction will be calculated by dividing 1 by the average time taken for the acidified potassium manganate solution to decolourise. By calculating the rate of reaction instead of merely using the time readings, graphs of the rate of reaction against temperature will be easier to analyse since the quicker reactions will be represented as a greater value for the rate of reaction rather than a small time value.
The results from the experiments were recorded in tables and plotted on a graph so that they are displayed in a manner that allows overall trends to be portrayed more effectively and become more obvious. It also allows a more accurate analysis of the results because the trends become clearer and any anomalies become apparent.
In order to analyse the results gained from the investigation, a statistical method was employed to measure the effect of temperature variation on the activity of the enzyme, sucrase. I have used the temperature coefficient, Q10 which is calculated by the formula: This measures the effect of a 10°C temperature rise on the rate of reaction.
Rate of reaction at t +10°C
Rate of reaction at t
This measures the effect of a 10°C temperature rise on the rate of reaction.
Likely outcomes – This experiment is aimed at finding the optimum conditions for the enzyme sucrase, which digests sucrose to glucose and fructose.
An enzyme is a complex globular protein that makes possible biochemical reactions that form the metabolism of living organisms by acting as a specific biological catalyst.
An increase in temperature has two effects upon the rate of an emzyme-catalysed reaction.
Graph of the likely effect of temperature
a) Over a certain temperature range (below optimum temperature), an increase in temperature increases the rate of reaction. Raised temperature cause the substrate and enzyme molecules to move with greater kinetic energy, so more collisions result.
The temperature coefficient (Q10) is the effect of a 10°C rise in temperature on the rate of a chemical reaction. For an enzyme controlled reaction, in the temperature range 4°C to 37°C an increase of 10°C doubles the rate of reaction (Q10=2).
b) Above the enzyme’s optimum temperature (the temperature at which the rate of reaction is maximum) the enzyme is rendered inactive. This occurs because as the temperature changes this supplies enough energy to break some of the intermolecular attractions between polar groups (Hydrogen bonding, dipole-dipole attractions) as well as the hydrophobic forces between non-polar groups within the protein structure. The heat causes a change in shape of the protein molecule – this is called denaturation. The active site is altered, preventing the enzyme from locking onto its substrate, so preventing the formation of an enzyme-substrate complex.
The enzyme sucrase is secreted by villi in the small intestine. The temperature of this part of the body is 37°C (body temperature). Since this is the temperature which the enzyme naturally operates in, it is logical to suggest that this will be the optimum temperature for sucrase.
Limitations and Precautions –
To act as a control in this investigation, I took one reading with the enzyme replaced by an equal volume boiled sucrase solution. This will ensure that the active enzyme alone is responsible for the hydrolysis of sucrose to glucose and fructose and that no other variable is responsible.
As a precaution, I have limited my contact with the test tubes, as my body heat will raise the temperature, increasing the rate of reaction. I will also monitor the temperature using a thermometer so that I can ensure that it stays constant and does not disrupt the results of the experiment by affecting the activity of the sucrase.
One limitation of the investigation is the range of pH and temperature that can be measured. In this investigation I will be recording the effect of temperatures of 22°, 30°, 35°, 40° 45°, 50°, 55°, 60°, 70° and 100°C. This means that the rate of reaction between these values can not be distinguished between or evaluated with sufficient accuracy. It would be difficult to identify the exact optimum temperature if it lay between the values measured or to justify the optimum temperature if the results indicated that it lay on one of those values.
To ensure that quantities of the various chemicals are measured accurately, I have used the smallest syringes or measuring cylinders for each quantity. For example, to measure 5ml of potassium manganate, I used a 5ml syringe. In this way, more accurate measurements can be made since more detailed gradations are available on the apparatus.
Safety –
Laboratory coats were worn during the investigation to prevent chemicals from spoiling clothes. Care was also taken when handling the chemicals as Sulphuric acid is corrosive and potassium permanganate is staining.
Results –
The results gained from this investigation have been plotted in the table below and on a graph to allow the results to be analysed effectively and so that accurate conclusions can be drawn.
Temperature
°C
Time taken to decolourise (s)
Rate (1/Time)
Average Rate
1
2
1
2
22
194
220
0.005
0.005
0.005
30
141
130
0.007
0.008
0.007
35
85
83
0.012
0.012
0.012
40
61
63
0.016
0.016
0.016
45
45
42
0.022
0.024
0.023
50
42
36
0.024
0.028
0.026
55
41
29
0.024
0.034
0.029
60
37
37
0.027
0.027
0.027
70
39
50
0.026
0.020
0.023
100
¥
¥
0.000
0.000
0.000
During the investigation, when the potassium permanganate was added to the enzyme-substrate solution, a colour change was observed. When the potassium permanganate was added the solution immediately turned purple. This colour gradually faded until it became completely decolourised.
In the table, for the temperature 100°, I have used the symbol for infinity for the time reading, since at this temperature, the potassium permanaganate did not decolourise. This means that the rate (calculated by 1/Time) is neglible and for all intensive purposes can be represented as zero.
In order to analyse the results gained from the investigation, I have employed a statistical method to measure the effect of temperature variation on the activity of the enzyme, sucrase. I have used the temperature coefficient, Q10. This measures the effect of a 10°C temperature rise on the rate of reaction. It is calculated using the formula:
Rate of reaction at t +10°C
Rate of reaction at t
Where t is the temperature 30°C, the Q10 is:
Rate of reaction at t +10°C
Rate of reaction at t
Rate at 40°C
Rate at 30°C
= 0.016133229
0.007392253
= 2.18
Where t is the temperature 35°C, the Q10 is:
Rate of reaction at t +10°C
Rate of reaction at t
Rate at 45°C
Rate at 35°C
= 0.02301587
0.01190644
= 1.93
A Q10 of around two means that a 10°C rise in temperature causes the rate of reaction to double. This is the normal reading for an enzyme controlled reaction and shows that the patterns in my results reflect the standard pattern.
The graph “A graph to show the effect of temperature on the enzyme sucrase” shows that up to 55°C, an increase in temperature resulted in a corresponding increase in the rate of reaction. This means increasing temperatures (up to 55°C), the sucrase enzyme was able to function more effectively and hydrolyse more of the sucrose to fructose and glucose which produced a greater rate of reaction.
With temperatures of the range 55°C to 100°C the rate of reaction decreases rapidly. Above 55°C, less sucrose is being digested by the enzyme and therefore the acidified potassium manganate decolorised slower, and the rate of reaction decreased.
The graph of the results displays a distinct peak at around 55°C. At this temperature the enzyme functions most effectively and is able to digest the substrate most efficiently and produces the fastest rate of reaction.
It is clear from the graph and table that at a temperature of 100°, the potassium permanagante did not dicolourise and that the rate of this reaction was zero and the enzyme had not hydrolysed any of the sucrose in to glucose and fructose.
A fairly precise trend line was drawn on the graph of the results which indicates few anomalies. However it is clear that the result obtained from a temperature of 45°C, which gave a time of 42 seconds on one of the readings, may have been a little low creating a slightly high reaction rate.
Conclusion and Discussion -
Up to 55°C, the rate of reaction of the hydrolysis of sucrose increased. As the temperatures rose the molecules moved faster (kinetic theory). In this reaction, this meant that enzyme and substrate molecules collided more frequently so that more enzyme-substrate complexes were formed and more products produced. When more products (glucose and fructose) are produced, the acidified potassium manganate decolorises quicker producing a faster rate of reaction.
Above 55°C the rate of reaction decreased rapidly with increasing temperatures. This occurred because rising temperature supplied enough energy to break some of the intermolecular attractions between polar groups (Hydrogen bonding, dipole-dipole attractions) as well as the hydrophobic forces between non-polar groups within the protein structure. The heat caused a change in shape of the sucrase protein molecule so that it became denatured. The active site was altered, preventing the enzyme from locking onto its substrate preventing the formation of an enzyme-substrate complex and the production of any products (glucose and fructose).
At a temperature of 100°C, the rate of reaction was zero as the acidified potassium manganate did not decolourise. This means that the enzyme sucrase was unable to break down the sucrose into glucose and fructose. The high temperature caused the molecules of the enzyme to vibrate so violently that they broke the delicate hydrogen and bonds that maintain the tertiary and quaternary structure of sucrase. With the structure of the enzyme disrupted, the active site of the enzyme could no longer accommodate the substrate molecule, no enzyme-substrate complex could be formed and the enzyme could not function. It was denatured.
In the hypothesis, I predicted that “The activity of the enzyme will be greatest at … 37°C (body temperature)”. In this investigation, however, the enzyme worked most efficiently (greatest rate of reaction) at a temperature of around 55°C. At this temperature the average rate of reaction was 0.029 (arbitrary units). This temperature is much higher than the natural temperature of the ileum (37°C) where sucrase is secreted in the body and functions naturally. At 37°C, in this investigation, the rate of reaction can be estimated at around 0.015 (arbitrary units) from the graph. I would have expected that at the temperature 55°C the enzyme should have been denatured by the violent vibration of the atoms in the enzyme molecule that can break the delicate hydrogen bonds that form the tertiary structure. If 55°C was the natural optimum temperature for sucrase then this would imply that at 37°C the enzyme would not be functioning efficiently. Therefore I feel that experimental error in the investigation may be the root cause of an unusual optimum temperature for the sucrase and that this result does not necessarily reflect the true nature of this enzyme.
In this investigation, although the actual results are not as I predicted in the hypothesis, the pattern and trend of the results is as I expected and outlined in “Likely Outcomes”. The graph ‘Graph of the likely effect of temperature’ shows the same trend that is produced from my results in this investigation, although the temperature readings are different on the graphs.
Graph of the likely effect of temperature
In ‘Likely Outcomes’ I stated that “below optimum temperature, an increase in temperature increases the rate of reaction… above the enzyme’s optimum temperature the enzyme is rendered inactive”. These predictions are correct from the results of my investigation. Because the overall trends are as I predicted, I can conclude that my investigation was carried out in a consistent and reliable manner that allowed accurate trends to be produced from the results. There are, however, major flaws that have meant that results occurred that were expected at lower temperatures. My consistent approach in the implementation of the experiment caused these flaws to be maintained throughout the investigation so that accurate overall patterns within the results were still produced. The errors that may have lead to the production of unusual results are discussed in “Possible Errors and Improvements” below.
Possible Errors and Improvements -
There are several sources of possible errors in the results of this investigation and there are many suggestions that may reduce these inaccuracies and improve further investigations in the future.
i) Source of Enzyme - The source for the enzyme sucrase in this investigation, was from a saturated solution of yeast. During the investigation, the yeast sedimented out and settled at the bottom of the beaker. Although a glass rod was used to stir the solution, when samples were taken for the readings of the investigation they may not have contained the exact quantity of sucrase although the volume drawn into the syringe remained constant. This would have contributed to the experimental error and the unusual results in this investigation.
ii) Accuracy in variation of temperatures - In order to vary the temperatures in this investigation, the substrate was heated using water baths and left to equilibrate for 5 minutes. The enzyme was then added and the boiling tubes left in the water bath for 10 minutes for the reaction to occur. This meant that it was the substrate and not the enzyme that was at the required temperature. When the sucrase was added, the extra volume in the boiling tube would have meant that the temperature would have dropped slightly. The enzyme would have been reacting with the substrate before its temperature had risen to the required temperature and equilibrated with the substrate. Although stirring with the glass rod would have decreased this equilibration time, part of each reaction probably did not occur at the exact temperature produced by the water baths.
iii) The result of this error would be that the results resembled those usually found at lower temperatures. For example, at a water bath temperature of 55°C, when the enzyme was added it was at a lower temperature, and therefore able to function much more effectively and produce many more products before it had chance to reach the full 55°C. Therefore the results for this temperature show much higher rates of reaction than those normally expected.
iv) Numbers of readings – Due to time restrictions in this investigation, I was only able to take two readings at each temperature variation. These readings were then average so that the extent of any anomalies would be minimised. However, to ensure that accurate results were being obtained a much greater number of readings should have been taken. In a future investigation, I would recommend that at least three readings should have been taken at each temperature variation.
v) Variation of temperature – In this investigation, I measured the rate of hydrolysis of sucrose by the enzyme, sucrase at varying temperatures. These temperatures were 22°, 30°, 35°, 40° 45°, 50°, 55°, 60°, 70° and 100°C. Although this is a fairly good range of temperatures, it is still difficult to conclude an exact optimum temperature for the sucrase enzyme. Although the graph ‘“A graph to show the effect of temperature on the enzyme sucrase” indicates an optimum temperature for the enzyme as being 55°C. However, from the results, I cannot be sure whether this optimum is not actually anywhere between 52.5°C and 57.5°C. To accurately determine the optimum temperature for the enzyme, sucrase many more measurements must be taken at a much greater number of temperature variations.
vi) Accuracy of measurements- In this investigation measurements of reacting quantities were measured using syringes. The size of syringe was selected to give the most accurate reading i.e. smaller syringes were used for smaller quantities. This meant that the scales on the apparatus allowed a more accurate determination of the exact quantity. When a measuring cylinder was used, care was taken to accurately align the base of the meniscus with the graduations on the scale. However, for example when 19cm3 of sucrose was measured out using a measuring cylinder, the quantity could only be measured to the nearest 0.5cm3 which gives rise to an uncertainty of 2%. Although this is within acceptable limits, it could be improved in a future investigation by using more accurate apparatus such as a burette.
vii) Accuracy of determining the end point – In this investigation, rate of reaction was measured by recording the time taken for the end point to be reached. The end point was determined by the complete decolorisation of the acidified potassium manganate solution. This was established by comparing it to a boiling tube containing just distilled water. However, as the purple solution becomes clearer it becomes very difficult the exact point at which it becomes totally decolourised. This may have resulted in inaccuracies in the measurements for the rate of reaction. In a future investigation, this problem may be eliminated by using a colorimeter that will detect the amount of light passing through the solution. It can be calibrated to read a transmission of 100% when the solution is decolourised and the time taken to read this transmission would form an accurate measurement and more accurate results for the rate of reaction.
Amylase - Planning
* Hypothesis
I predict that as the temperature increases, the speed of the reaction will increase. When a particular temperature is reached I believe the rate of reaction will dramatically decrease. I believe this because most chemical reaction happens faster when the temperature is higher. At higher temperatures molecules mover around faster, which makes it easier for them to react together. Usually, a rise of 10OC will double the rate of reaction. This is true for enzymes up to about 40OC. However at 40OC the enzyme begins to be damaged, so the reaction slows down. By 60OC the enzyme is completely denatured. I predict that the same will happen the further away the pH is from pH 7. I believe this because the optimum temperature for most enzymes is about pH 7 therefore the further away from pH 7 (either more alkaline or more acidic) the less affective the enzyme.
* Pilot Experiment
To investigate the factors affecting the activity of the enzyme Amylase, I will adapt a pilot experiment, which investigates if the enzyme amylase breaks down starch. The pilot experiment was:
* Pour amylase solution into a test tube to a depth of 2cm.
* Half fill another test tube with a 4% starch solution.
* With a pipette place a drop of iodine into each dimple in a dimple tray.
* With a glass rod lift a drop of the starch solution from the test tube and mix it with the first drop of iodine in the first dimple in the tray. A blue/black colour should develop; this will be used as the control.
* Rinse the glass rod.
* Pour amylase solution into the test tube of starch and shake quickly.
* Repeat steps 4 & 5 (for the amylase & starch solution mixture) every 30 seconds until a blue/black colour no longer develops.
* When there is no further change in the colour of the iodine, take the starch-amylase test tube, add Benedict's reagent, and place in the water bath for 1 minute.
* Adapted Experiment
I will modify and expand the pilot experiment in a number of ways. Firstly I must decide what I'm going to investigate. I am going to investigate the effect of pH and temperature on the activity of the enzyme amylase. Therefore I have developed two similar experiments (one for each factor I'm investigating).
To investigate the effect of pH on the activity of the enzyme amylase:
* Pour amylase solution into a test tube to a depth of 2cm.
* Half fill another test tube with a 4% starch solution.
* With a pipette place a drop of iodine into each dimple in a dimple tray.
* With a glass rod lift a drop of the starch solution from the test tube and mix it with the first drop of iodine in the first dimple in the tray. A blue/black colour should develop; this will be used as the control.
* Rinse the glass rod.
* Add 2cm3 of the appropriate pH buffer to the starch solution and shake.
* Pour amylase solution into the test tube of starch and shake quickly.
* Repeat steps 4 & 5 (for the amylase, starch & pH buffer mixture) every 30 seconds until a blue/black colour no longer develops.
* Record the results in a table. Repeat steps 1-8 for each pH buffer range until all the provided pH buffers have been used.
To investigate the effect of temperature on the activity of the enzyme amylase:
* Pour amylase solution into a test tube to a depth of 2cm.
* Half fill another test tube with a 4% starch solution.
* Cool both test tubes and maintain at 10OC
* With a pipette place a drop of iodine into each dimple in a dimple tray.
* With a glass rod lift a drop of the starch solution from the test tube and mix it with the first drop of iodine in the first dimple in the tray. A blue/black colour should develop; this will be used as the control.
* Rinse the glass rod.
* Add 2cm3 of water to starch solution (see below).
* Pour amylase solution into the test tube of starch and shake quickly (measure temperature, try to maintain at 10OC).
* Repeat steps 4 & 5 (for the amylase & starch solution mixture) every 30 seconds until a blue/black colour no longer develops.
* Record the results in a table. Repeat steps 1-9 increasing the temperature by 5OC each time until the enzyme is denatured, this should be around 40OC (see part 6 on enzymes.)
To ensure that the test is fair I will only vary two factors (at different stages of the experiment not simultaneously). All the quantities will have to be carefully measured since small variations in the amount of enzyme used can make significant variations in the results. In the section where temperature is investigated, 2cm3 of water is added. This is because the starch solution is neutral and in the previous investigation (for pH) 2cm3 of the appropriate buffer was added. If the 2cm3 of water was not added then it would not be a fair test since the volumes used in each part of the investigation would be different. If they were different then this would affect the results since the solution would be of different concentrations and therefore one would react faster than the other would.
* Apparatus
I have chosen to use a measuring cylinder to measure the volumes of substances used since it is more accurate than a pipette. I will use an electronic water bath for maintaining the mixture at a temperature above room temperature since the temperature is more accurate than a water bath above a Bunsen burner. I will have to use ice from the freezer to reduce the temperature of the mixture to 10OC. A 100OC thermometer will provide temperature results of a sufficient accuracy (to 1OC). The pH buffer range will be pre-prepared therefore I do not have to concern myself with measuring and maintaining pH levels.
* Variables
I have chosen to repeat the experiment 3 times because it therefore allows me to calculate an average time. This will ensure that there are no abnormal results and it will increase accuracy. I have decided to start the temperature at 10OC and increase by 5OC each time since it will allow me to see the increase and decrease of the enzyme activity. It should also be accurate enough for me to predict an optimum operating temperature to an accuracy of 5OC. I have no control over which pH buffers I will use since the school prior to the experiment will provide them.
* Enzymes
Substances called catalysts speed up many chemical reactions. Catalysts called enzymes control the metabolic reactions in the body. Amylase is an enzyme; it is present in the digestive systems of many animals. Amylase speeds up the breakdown of long chain starch molecules in smaller chains of maltose. Enzyme molecules have a very precise three-dimensional shape. This includes a 'dent', which is called the active site. It is exactly the right size and shape for enzyme's substrate to fit into (in the case of amylase this is starch). When a substrate molecule slots into the active site, the enzyme 'tweaks' the substrate molecule, pulling it out of shape and making it split into product molecules. High temperatures make enzymes inactive: this is because they are proteins, which are damaged by temperatures above about 40OC. Most enzymes work best at a pH of about 7. This is also because they are proteins, which are damaged by very acidic or very alkaline conditions. Due to the enzyme's unique active site it can only convert one kind of substrate molecule into one kind of product.
First of all the average time taken for the starch to be digested in each condition was calculated.
Temperature(OC) 10 21 32 40 50 55 60 67 80&90
Average Time (min) 9.8 6.7 5.3 5.5 3.5 3.0 3.5 4.5 10 +
pH 8 7 6 5 3 2
Average Time (min) 9.5 6.7 4.5 2.8 4.7 9.2
The results were then plotted on a graph (see Graphs 1 & 2) and the points joined together.
From graph 1, I can see that as the temperature of the mixture increases, the time taken for the amylase to digest the starch decreases. This happens fastest at 55OC, however if the temperature continues to rise then the time taken for the amylase to digest the starch rapidly increases. By the time 80 OC is reached the amylase does not digest the starch. From graph 2, I can see that as the pH of the mixture increases, the time taken for the amylase to digest the starch decreases. This happens fastest at pH 5. At a higher pH level than pH 5 the time taken for the amylase to digest the starch increases.
Amylase speeds up the breakdown of long chain starch molecules into smaller chains of maltose. Enzyme molecules have a very precise three-dimensional shape. This includes a 'dent', which is called the active site. It is exactly the right size and shape for the enzyme's substrate to fit into (in the case of amylase this is starch). When a substrate molecule slots into the active site, the enzyme 'tweaks' the substrate molecule, pulling it out of shape and making it split into product molecules.
High temperatures make enzymes inactive: this is because they are proteins, which are damaged by temperatures above about 40OC. In this investigation it was found that amylase operated fastest at 55 OC and was damaged above this temperature. The enzyme is damaged because the molecules are moving faster, these bombard the active site of the enzyme changing its shape; when it's shape has been changed then the starch will no longer fit in the active site and therefore cannot be digested. This is 15 OC above the suggested typical temperature, see Evaluating Evidence for possible reasons why it is higher than expected. By 80OC the amylase was completely denatured. From this information I can conclude that the optimum operating temperature for the enzyme amylase is 55OC.
Most enzymes work best at a pH of about 7. This is also because they are proteins, which are damaged by very acidic or very alkaline conditions. However in this experiment the amylase worked fastest at pH 5. This pH is lower than suggested above because the amylase provided by the school was a bacterial enzyme which had an optimum pH between pH 4 and pH 5.
In my design I predicted: that as the temperature increases, the speed of the reaction would increase. When a specific temperature was reached, I believed that the rate of reaction would dramatically decrease. I believed this because most chemical reactions happen faster when the temperature is higher. At higher temperatures molecules move around faster, which makes it easier for them to react together. Usually, a rise of 10OC will double the rate of reaction. This is true for enzymes up to about 40OC. However at 40OC the enzyme begins to be damaged, so the reaction slows down. By 60OC the enzyme is completely denatured. I predicted that the same would happen the further away the pH is from pH 7. I believed this because the optimum temperature for most enzymes is about pH 7 therefore the further away from pH 7 (either more alkaline or more acidic) the less effective the enzyme.
My results support most of the prediction since as the pH/temperature increases the rate of reaction increases until a point is reached and then the rate of reaction decreases. However, the optimum temperature was not 40 OC but 55 OC (unusually high) and the optimum pH was pH 5 not pH7. I also predicted that a rise of 10 OC would double the rate of reaction, this was not correct. As is evident in the table above, the time taken does not halve for every 10OC increase in temperature. I could not find a linear relationship between the temperature and rate of reaction, however with enough results (from a very large range of temperatures) a parabola could be made on Graph 1, it would then be possible to find a mathematical formula for the construction of the parabola and hence find the relationship between the temperature and rate of reaction. At current I do not have enough reliable evidence to draw any conclusions more specific than the rate of reaction is proportional to the temperature until 55OC is reached and after this point the temperature is inversely proportional to the rate of reaction.
Note: "Optimum operating temperature/pH" means this is the temperature/pH where the enzyme (amylase) operates the fastest.Evaluating Evidence
I believe that the experiment was successful but some of the results were unexpected/unreliable. The time taken for the amylase to digest the starch at 40 OC was far too fast (see Graph 1) it should have been between 4 and 4.5 minutes. All the other results seemed to fit into the trend on the graphs.
I believe that the experiment was designed well but there were a few problems. The optimum temperature for the amylase was too high. I believe that all the results were skewed because the enzyme was not given enough time at each particular temperature to be fully affected before it was added to the starch. Because of time restraints they were only left in the water bath for 10 minutes before starting the experiment. However, they should have been left in the water bath for about 30 minutes so that the amylase had been completely affected by the temperature before the experiment was started.
I decided to conduct the experiment at 10 OC intervals instead of 5 OC because there was not enough time. When the results were collected I plotted them on a rough graph to find the optimum temperature and then conduct the experiment at this temperature to ensure it was the optimum temperature. I also conducted all three experiments for each condition at the same time to save time.
Additional work, which could be carried out, is to repeat the experiment using, a wider range of temperatures and pH levels, a range of different starch solution concentrations or using different enzymes such as protease with a protein.