FIGURE 3: A PLASMOLYSED ONION CELL IN A MICROSCOPE X400
Incipient Plasmolysis
Is the stage just before that, when the cell is just about to become plasmolysed. At this point, the pressure potential is zero. Incipient plasmolysis is defined as the point at which the plasma membrane has just begun to pull away from the cell wall, such that the turgor pressure is zero and its osmotic potential would be expected to be equal to that of the external solution because the cell wall in not exerting any pressure on the cytoplasm. For the purposes of this experiment incipient plasmolysis was defined as the point at which 50% of the cells in a sample were plasmolysed as interpolated from the raw data set.
Water potential = osmotic (solute) potential + pressure potential
If pressure potential = 0. Then water potential = solute potential
The water potential of pure water is defined as zero and is lowered by solute addition creating a gradient for the movement of water into cells by osmosis.
There are two factors that influence water potential;
- The concentration of solutes inside the cell.
- The pressure exerted on the cell contents by the stretched call surface membrane or cell wall.
Pressure Potential:
Pressure potential is the difference between the absolute pressure in the water and atmospheric pressure: since the reference potential ψ0 is defined for water at STP, only pressure differences from atmospheric contribute to pressure potential.
Water under pressure has a higher capacity to do work (like knocking over football hooligans at the end of water cannon). Pressure potential may be positive (physical pressure): water in a hosepipe has a high pressure potential. It may also be negative (tension): water being 'stretched' in a sealed syringe has a low pressure potential. Cells that are turgid (left) have a large positive pressure potential (the water presses out on the cell wall, and the wall presses back on the water with an equal but opposite force). Cells that are flaccid or plasmolysed (right) have a pressure potential of zero
FIGURE 4 (LEFT) A TURGID CELL AND (RIGHT) PLASMOLYSED CELL
Solute Potential
ψπ is the solute (chemical) component: pure water will flow from where it is in high concentration (i.e. dilute solutions) to where it is in low concentration (i.e. concentrated solutions).
ψπ is also written as ψs and called the solute potential. These terms are synonymous.
Pure water contains no solutes, so ψπ = 0, as it should. Water will tend to flow from dilute solutions (or pure water) to concentrated solutions through a water-permeable membrane. ψπ of a solution is always negative, because all solutions contain less water than the same volume of pure water.
Solute or solute potential is a main component of the water potential, which reflects the amount of solutes dissolved in plant tissues.
TABLE 1 SHOWING THE RELATIONSHIP BETWEEN MOLARITY AND SOLUTE POTENTIAL OF SUCROSE SOLUTIONS
Osmotic Potential
The osmotic potentials of plant tissues are highly variable and are related to an organ’s age and function, and the plant’s external environment. For example, plant organs that are specialized for the storage of carbohydrates (i.e., sugars, starches) would be expected to have higher solute concentrations, and thus lower osmotic potentials, than equivalent organs that do not serve a storage function. Similarly, organs that are in a meristematic condition would be expected to have faster metabolic rates and thus higher concentrations of enzymes and/or cellular metabolites (and lower osmotic potentials), than equivalent older, more mature organs. In addition, several plants are able to lower their osmotic potentials in response to desiccation by means of a process termed osmotic adjustment that involves the net accumulation of solutes in the cell interior and facilitates the maintenance of positive turgor pressures.
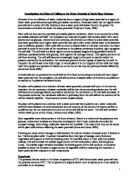
Prediction
My pilot study results give me a base for a prediction, although the pilot study was carried out using a microscope and counting to see how many plasmolysed and how many were not plasmolysed, it still gives me an idea at which solution it would be plasmolysed. This means, I already can see a trend forming for my experiment. This is, in short, a water potential of potato tuber tissue around 0.35M sucrose and as the solute potential of the external solution increases, as does the mass loss of the potato chips. I predict that for my experiment that as I increase the solute potential of the external solution from 0KPa to -1120KPa the mass gain will decrease as the solute potential decreases. I expect the line to cross the x-axis when the sucrose solution is at around 0.30M to 0.35M (this is between -800KPa and -900KPa, see table 1). I get the estimated value for the water potential of the tissue by looking at my pilot study graph and results. I expect my result to be slightly different than what I obtained from my pilot study, because of the limited amount of time I was able to allow the potato chips to spend in the solutions. This would not have given very accurate results for my pilot study. I predict this to happen because of osmosis. If the two water potentials of two systems either side of a partially permeable membrane are the same, then there will be equilibrium and there will be no net movement of water molecules. This means that the potato chip will neither gain nor loose mass (thus the y-value is 0 on a graph). However, when the solute potential of the solution on the outside of the potato chip falls (becomes more negative) then the equilibrium of the systems changes:
Ψ = Ψp + Ψs
A measure of the tendency of a system or cell to give up water to another system. Water flows from a higher to a lower water potential, so any system with a positive will pass water into a system with a zero or negative . Pure water at standard temperature and pressure is assigned a water potential of zero. The presence of a solute in water lowers the water potential to give a solute potential s, which is therefore always negative. Osmosis should be seen as the movement of water from an area of less negative s to an area of more negative s. The concept has particular significance for plant cells, in which hydrostatic pressure and the pressures associated with the cell wall generate the pressure potential required to produce support for structures such as young stems and leaves to prevent them from wilting. When the pressure potential is at a maximum, the water potential is zero and the cell is said to have maximum turgor (to be fully turgid). The water potential is related to the solute potential s and the pressure potential p
by the equation = s + p.
Variables
Dependant Variable
My dependant variable is the mass change of the potato chips while they are in solution. I will measure this by weighing the chips before and after a set time period in the solution. This then gives me a relation to how much water is lost to the solution.
Independent Variable
The independent variable is the molarity, or solute potential, of an external sucrose solution. These vary from 0KPa to -1120KPa.
Control Variables
Time: If a two chips are left in the same solution, both loosing water through osmosis, then if one is taken out before the other, then it will be osmosing for a longer period of time, and thus loose more water, and mass. I will control this by timing the time of each potato chip spends in solution, and keeping it the same for each chip. Time is measured to the nearest minute, using a stopwatch.
Volume and Surface Area: If there is a higher surface area then there will be more places for water to leave the tissue, so the rate of osmosis will increase. If there is a larger volume, there will be more water to be lost from the tissue of the plant, and so a higher mass loss is potential. To control these variables I use the same diameter potato corer and cut all chips to the same length at all times. I will cut to the nearest millimetre, using a 15cm ruler. Also the volume of the sucrose solution will affect the experiment therefore the volume of the sucrose solution must be kept the same at all times that is at 40cm3.
Pressure: The pressure exerted on the potato must be kept constant so that the equation ψ = ψp + ψs is not disturbed by fluctuating pressure potentials. The only thing that should affect pressure is the volume of sucrose solution placed on the chips, so I will keep this the same by having a constant final volume for all my dilutions.
Potato Type or age: Different potatoes may have different water potentials in their tuber tissue, and to make sure I am not trying to measure different water potentials I will have to use potatoes with approximately the same age, and same breed. But to make the experiment more accurate I will use just one potato and make sure it is peeled. This is because potato skin is impermeable.
Preliminary Investigation
This experiment was carried out using and onion cell and was quite different compared to the potato experiment. However, incipient plasmolysis and the water relations in red onion cells are no different to any other plant cell - there are no special factors operating in red onions, the reason that they are used for osmosis experiments is that, because of their coloured cell sap, you can actually see plasmolysis much easier than in other cells. Plasmolysis occurs when the pressure potential effectively becomes negative.
A solution with a solute potential which is equal to the solute potential of the cells will cause incipient plasmolysis.
Evaluation of Preliminary Investigation
The experiment as a whole was quite good for a pilot study. However there were problem with the experiment such as the accuracy, relevance to the real experiment, the equipment, method e.t.c.
Accuracy
- In the experiment, to find the solute potential of the onion cells, you must find a concentration of sucrose or salt that causes incipient plasmolysis. You do this by mounting a layer of onion cells in varying strengths of sucrose solution, and count the % of plasmolysed cells. You cannot actually see 'incipiently plasmolysed cells - they do not look any different to unplasmolysed cells, but you count incipient plasmolysis as the point where 50% of the cells are plasmolysed and 50% are not. You are unlikely to get a sugar conc. which causes exactly 50% plasmolysis so you draw a graph of conc. against % plasmolysis and read off the conc. that would cause 50% plasmolysis. Whatever concentration this is, its solute potential will be the same as that of the cells.
- It is difficult to count 20 cells using a microscope and then say which cells are plasmolysed and which cells are not plasmolysed. In a situation like this many people are likely to rely on demand characteristics. The person carry out the experiment will want his/her results to collaborate with their prediction so they make the number to suit the prediction not the right numbers while others just can not be bothered therefore they give wrong outright answers.
- Also, in the real experiment it would be difficult for me to put a potato tuber under a microscope so I will be using an electronic scale to check the weight of the potato tuber and then find the point at which there is no change in mass. This will be used because this method is more accurate than using a microscope to look and count. The potato tuber is thicker than an onion cell.
- When this experiment was carried out, already made sucrose solution was used. The person who made them might have used the wrong amounts to make them and there is also the possibility of a wrong labelling.
Relevance to Real Experiment
- This study was carried out to see how it relates the real experiment when it is carried out.
- However some of the method does not relate to the experiment that will be carried out using potato tubers to determine the water potential.
- For example, I will be using weighing method because it is more accurate than the ruler method. The ruler does not measure the change in diameter while the weighing method gives you an accurate measure of the change in size of the potato.
Evaluation of Secondary Data
To help make this experiment more valid, secondary data need to be evaluated and used to make the real experiment better, it also shows mistakes to avoid and good thing to emulate.
Data on Potato Tissue from US School
Below is the table from a school in the US which shows the percentage change in mass of the potato tissue after it has been left in various sucrose concentrations.
TABLE 2 DATA ON POTATO FROM A US SCHOOL
This table has several mistakes in it. Some of the values in the mass difference column have been wrongly calculated. Below is a table showing the table with the correct figures.
TABLE 3 DATA ON POTATO TISSU FROM A US SCHOLL WITH CORRECTIONS
The new figures have been implemented so use it to draw a graph. Using the graph pinpoint the point where the potato tuber was incipiently plasmolysed. The potato was incipiently plasmolysed around 4.25 and 4.50. While this method is a good way of showing the data and also of working out the water potential of the potato tubers. The experiment was carried out by more than one student it says a school so this is the average value the total number of students who carried out the experiment but if one person carried out the experiment, for example the next secondary data there is more likely to be less mistakes. The values on the graph show a negative correlations which say that the higher the concentration in the lower the final mass therefore giving a lower change in mass.
GRAPH 1 CORRECTED US SCHOOL DATA
Marilyn Biology Lab Technician
TABLE 4 MARILYN'S TABLE OF VALUES
GRAPH 2 MARILYN'S DATA
Looking at the graph 2 and the table 4 it is obvious that the water potential for the potato tuber was found at exactly 0.40 mol dm -3 of sucrose solution. The graph also show a negative correlation and also adhere to the theory that as the sucrose concentration increases the final length becomes negative also making the percentage change in mass negative. It can be said that because Marilyn is a technician and has probably done more than one try to get her results so it is more likely to give perfect results.
Furthermore there are results that make the graph look like an anomalous result but it is due to the fact the length of the potatoes varied when compared to the table of values from the US school it is obvious that the mass of the potatoes were in close range so it did not affect the results. So when doing the real experiment make sure the mass of the potato chips are close together or the same.
Apparatus
TABLE 5 APPARATUS TABLE SHOWING THE USES AND REASONS FOR EACH APPARATUS
Method
-
The first thing to be done is to make the different concentration of sucrose Label appropriate beakers and graduating pipettes with either H2O or sucrose.
- Add the correct volumes of water and sucrose; using the appropriate graduating pipette to make sure that there is no contamination; to the correct sample tubes. When reading a volume off the graduating pipette, make sure the pipette is at eye level, and read from the bottom of the meniscus.
- The sucrose solution will be 40ml. 40ml of sucrose is being used because the experiment is going to be overnight and so there must be enough solution to cover the tuber so that there is a better chance of osmosis taking place. Below is a table showing how the solutions will be made and what ratio of water will be required to a ratio of sucrose.
-
Label sample tubes from 0.30, 0.35, 0.40, 0.45, 0.50, 0.55 and 0.60 mol dm-3 sucrose solution. Put 40ml of the appropriate sucrose solution in each the six sample tubes. Then firmly put a lid on each tube
- Take cores of potato of 1.5cm diameter. Cut off the skin on the ends and cut them to 3cm length until there are 18 chips. 18 chips are required because I am going to be doing three separate repeat for each concentration. When cutting the chips to length, make sure to cut looking from above, so to avoid parallax errors. Try to cut as straight as possible, to avoid further error.
- Weigh all of the chips and record the initial weights, also try to make the weight the same.
- Start the stop-clock and add a core to each solution using forceps at five-second intervals (don't forget to record which core went in which solution) cover the sample tubes using lids. Note the time
- Label a piece of paper towel and arrange it on a white tile, so when the chips come out of solution they are ordered
- When the time is 24Hours take the chips out at a 5 second interval, and place them on the labelled piece of paper towel.
- Gently dab excess solution of the potato, on the side and ends, then weigh and record the mass of the chips of each solution. Try to be consistent with time and pressure while drying chips; this means the water removed from the chips should be kept consistent and so minimising error. Put in the values in the result table. Below is an example of my result table:
- Work out the mass change in all the chips, and then the percentage mass change of all the chips using:
Percentage = Old Weight – New Weight x 100
Old Weight
- Plot a graph containing all data and the table with a suitable title. When plotting the graph plot the percentage changes against the different sucrose solution.
Precaution
- Make sure that lids are tightly shut so there are no evaporation which would lead to wrong calculations
- Avoid parallax errors, erroneous data and extraneous data
- Do not over rub the potatoes when it is brought out from the solutions so that it does not shrink lead to wrong mass values
Risk Assessment
- Ensure that all electrical appliances are not kept next to water
- Always dry your hands before touch electrical appliance
- Do not fold the wires of any electrical appliances
- Avoid spillages but in case of spillages use the paper towels to clean it up but if it is quite serious inform the technicians
- Always tie back long hair and loose clothing
- Wear goggles and lab coat at all times. If required wear rubber gloves
- Only enter a laboratory when told to do so by a technician .
- Do not rush or round and most importantly do not panic.
- Keep your bench and nearby floor clear, with bags and coats well out of the way
- You should not carry out practical work unless supervised by a member of staff.
- Follow instructions precisely
- Check bottle labels carefully and keep tops on bottles except when pouring liquids from them;
- Only use equipment and materials required for the experiment
- Never remove anything from the laboratory without permission.
- Wear eye protection, a lab coat and protective gloves when told to do so. You should continue to wear them until all practical work is finished and cleared away.
- When using electrical equipment, ensure that mains plugs are fully inserted into the socket before switching on at the socket.
- Ensure that your hands and the working area are dry before operating any electrical equipment. Do not use equipment with frayed or damaged cables.
- When using a Bunsen burner, make sure that ties, hair etc. are tied back or tucked away.
- Do not taste anything or put anything in your mouth in the laboratory. If you get something in your mouth spit it out at once and wash your mouth out with lots of water. Get help immediately.
- Always wash your hands carefully after handling chemicals, and plant material.
- Report any accident or breakage to your technician immediately.
- Report broken glassware to a member of staff. Broken glass should be disposed of in a special container and not in the bin.
- Never put waste solids in the sink. Put them in the bin unless your technician tells you otherwise.
- Report all spills to your technician immediately.
- Most importanly if unsure about any thing ask your teacher or the technician.
Bibliography
Jonathan Wilson , Biology Teacher, Havering Sixth Form College
Taiz, L. and Zeiger, E. (2002). Plant Physiology. 3rd edition. Sinauer Associates Incorporated, Sunderland, Massachusetts. 33-46. "Water and plant cells"
Practical advanced Biology, by Tim King, Michael Reiss and Michael Roberts, pages 58-59
Medical Dictionary. The American Heritage® Stedman's Medical Dictionary Copyright © 2002, 2001, 1995 by .
Marilyn, Biology Laboratory Technician, Havering Sixth Form College
Biology AS Induction Handbook, Havering Sixth Form, Page 11, Laboratory Rules
Table of Figure
Figure 2 Water will flow spontaneously from a high potential to a low potential, like a ball rolling down a hill.
Figure 3: A Plasmolysed Onion Cell in a Microscope x400 _
Figure 4 (Left) a turgid cell and (Right) Plasmolysed cell
http://www.visit-islay.com/biology/int2/graphics/cells/plantosmosis.gif
http://www.steve.gb.com/science/water_potential.html
http://www.pgjr.alpine.k12.ut.us/science/whitaker/Cell_Chemistry/Plasmolysis.html
http://www.steve.gb.com/science/water_potential.html