2 H2O2 2 H2O + O2
Hydrogen peroxide makes an ideal substrate as its decomposition products that is oxygen gas and water are not harmful and can be collected easily and measured by the displacement of water.. Caution should be taken when handling with hydrogen peroxide as it is very corrosive.
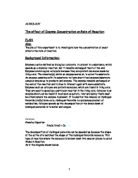
Image 5: Molecular structure of hydrogen peroxide
Buffer Solution
A buffer solution is an aqueous solution consisting of a mixture of a weak acid and its conjugate base or a weak base and a conjugate acid. A buffer solution has the property of resisting changes in pH when a small quantity of an acid or alkali is added to it. This is especially crucial in living organisms as many life form thrives only in a very small range of pH.
There are two types of buffer solutions that is an acidic buffer solution and an alkaline buffer solution. The acidic buffer solution made from a weak acid and one of its salts which is often a sodium salt.
In this experiment, a buffer solution of pH 6.5 was mixed with the blended potato before it is reacted with hydrogen peroxide. The buffer solution counteracts pH solution by releasing or binding to hydrogen ions (H+). During the decomposition reaction of hydrogen peroxide, H+ are released as an intermediate product. The H+ added to solution will cause the equilibrium of the equilibrium of reaction to shift to the left as there are more H+ and H+ + OH-. On the other hand, when hydroxide ions (OH-) are added to the solution, the equilibrium will shifts to the right as hydrogen ions are removed in the reaction, H+ + OH- H2O2. The buffer solution plays a crucial role to prevent changes in pH which cause enzyme activity to be reduced.
Problem Statement:
What is the effect enzyme concentration on the rate of reaction?
Hypothesis:
As enzyme concentration increase, the volume of oxygen gas collected increases, indicating a higher rate of reaction.
Variables:
Manipulated variable: Enzyme concentration
Responding variable: Volume of oxygen gas collected which indicates the rate of reaction
Constant variable: pH, temperature and concentration of the substrate
Materials:
Water, hydrogen peroxide, blended potato, pH6.5 buffer solution
Apparatus:
5ml measuring cylinder, test tubes, test tube rack, graduated tube, beaker, spatula, bung, stopwatch, delivery tubes and droppers.
Technique:
Volume of oxygen gas evolved by the decomposition reaction of hydrogen peroxide into oxygen gas and water by enzymes in the potato was collected in a graduated tube that is fully filled with water before being immersed in a beaker filled with water. The volume of oxygen gas collected in the graduated tube was measured every 10 seconds for 1 minute by reading the scale on the graduated tube.
Procedure:
- One spatula of blended potato is taken and placed into a test tube.
-
5cm3 of pH6.5 buffer solution was measured using a measuring cylinder and a dropper and transferred into the same test tube. The test tube is then swirled to allow the buffer solution and blended potato to mix evenly and the test tube is left to stand upright in the test tube rack.
-
A 250cm3 beaker was filled with water. A graduated tube is completely filled with water. The mouth of the tube is covered fully with a thumb and it is inverted carefully into the beaker.
- A delivery tube is connected with its end inserted under the graduated tube through its mouth.
-
Using a clean droppers and another measuring cylinder, 2.5cm3 of hydrogen peroxide is measured and added to the test tube containing the mixture of blended potato and buffer solution.
- The bung of the delivery tube is immediately placed into the mouth of the test tube.
- The volume of gas collected in the graduated tube was observed and recorded every 10 seconds for one minute.
- Step 1-7 is repeated thrice by using two, three and four spatulas of blended potato instead.
- The times and volume of oxygen gas collected is tabulated. (Table 1)
- A graph of volume of gas collected against time is plotted. (Graph 1)
- The initial rate of reaction is calculated from the gradient of the curve at point (0,0) and tabulated. (Table 2)
- Another graph of initial rate of reaction against enzyme concentration is plotted. (Graph 2)
Results:
Table 1: Volume of oxygen gas collected for each number of spatulas of blended potato
Graph 1: Graph of volume of oxygen gas collected against time for each number of spatulas of blended potato
Calculations of initial rate of reaction
For 1 spatula of blended potato,
Initial rate of reaction cm3s-1
cm3s-1
For 2 spatulas of blended potato,
Initial rate of reaction cm3s-1
cm3s-1
For 3 spatulas of blended potato,
Initial rate of reaction cm3s-1
cm3s-1
For 4 spatulas of blended potato,
Initial rate of reaction cm3s-1
cm3s-1
Table 2: Initial rate of reaction for different enzyme concentrations
Graph 2: Initial rate of reaction against enzyme concentrations
Discussion:
Graph 1 is a graph of volume of oxygen gas collected for each number of spatulas against time where there are four curves with each curves representing the enzyme concentration for one, two, three and four spatulas respectively. From the data tabulated in Table 1 and the curve plotted in Graph 1, it can be observed that the general trend is that an increase in enzyme concentration is followed by an increase in the volume of oxygen. At the beginning of the experiment, from 0 seconds to 10 seconds, the rate of reaction increases steeply for each spatula. This is indicated by the steep gradient of the curve at that period. The line drawn between 0 seconds to 10 seconds is nearly straight, indicating that the increase in the rate of reaction is constant during this time. The volume of oxygen gas collected is directly proportional to the number of spatulas of enzyme used. At the beginning of the experiment, the number of hydrogen peroxide molecules is high and as a result the enzyme concentration does not limit the rate of reaction. The enzyme catalase continuously binds with the hydrogen peroxide molecules and catalyzes the substrate into oxygen gas and water.
From 10 seconds to 20 seconds, the steepness of the gradient of the curves representing each spatula has decreased. This shows that for the same period of 10 seconds, less hydrogen peroxide molecules is decomposed and less oxygen gas is collected in the graduated tube as compared to the first 10 seconds of the experiment. The volume of oxygen collected is no longer proportional to the number of spatulas of enzyme used except for the enzyme concentration of one spatula. This is because there is less hydrogen peroxide molecules left as quite a large amount has been catalysed into its decomposition products that is oxygen gas and water in the first 10 seconds. As more and more substrate molecules is catalysed into its products, the substrate molecules left uncatalysed decreases. There are more enzyme than substrate molecules now and not all active sites of the enzymes are occupied throughout the 10 seconds. The amount of substrate a molecule now become a limiting factor and limits the rate of reaction. However, this cannot be said the same for the enzyme concentration of one spatula in which the volume of oxygen gas collected against enzyme concentration remains directly proportional. For the lowest concentration, there are more substrate molecules than enzymes. This is because the concentration of enzyme is the lowest among the four concentrations and is only a quarter highest enzyme concentration and the number of enzyme present is relatively much lower when compared to the other three enzyme concentrations. Less hydrogen peroxide was catalyzed into its decomposition products in the first 10 seconds and more molecules that have yet to be catalyzed are present. Thus, the amount of substrate present does not become a limiting factor and the rate of reaction increases constantly for the enzyme concentration of one spatula.
For each of the curve which represents a different enzyme concentration in Graph 1, a tangent was drawn from the origin to determine the initial rate of reaction. For all the four curves, the tangent drawn shows a positive correlation indicating that the volume of oxygen gas collected increase as the enzyme concentration increases. It is also noted that the gradient of tangent for each curve increases starting from an enzyme concentration of one to four spatulas. The gradient of each tangent is calculated by dividing the volume of oxygen gas by the time. The initial rate of reaction can be represented by the volume of oxygen gas divided by the time. Thus, the initial rate of reaction is equal to the gradient of the tangent to the curve for each different enzyme concentration.
The enzyme concentration of four spatulas has the steepest gradient and fittingly the highest initial rate of reaction at 0.75 cm3s-1 while the enzyme concentration of one spatula has the least steep gradient and the lowest initial rate of reaction that is at 0.2 cm3s-1.
From the initial rate of reaction calculated from Graph 1, a table showing the initial rate of reactions for different enzyme concentrations was formed and from this table, Graph 2 which is a graph of initial rate of reaction against enzyme concentration was plotted. From Table 2, it can be observed that the initial rate of reaction is the lowest for the enzyme concentration of one spatula. The initial rate is 0.2 cm3s-1. This shows that 0.2 cm3s-1 of oxygen gas is liberated in the first second of the reaction. When 2 spatulas of blended potato are used, the enzyme concentration also doubles to 0.417 cm3s-1. The same can be said when three spatulas of blended potato is used as well resulting in the initial rate of reaction at 0.633 cm3s-1. This is because when the enzyme concentration is doubled, the amount of enzyme-substrate complex formed is double causing double the amount of oxygen gas collected indicating in a doubling of the rate of reaction.
However, the initial rate of reaction for the enzyme concentration of four spatulas which is 0.75 cm3s-1 is less than the 0.8 cm3s-1 that is the initial rate of reaction for the enzyme concentration when 1 spatula is used multiplied by four. This shows that the increase initial rate of reaction is not directly proportional when 4 spatulas of blended potato are used. This shows that the concentration of substrate used starts to limiting the initial rate of reaction. At this point there are free active sites on enzymes than substrate molecules present. An increase in enzyme concentration would not cause the initial rate of reaction to increase.
Evaluation:
Throughout the experiment a number of precautions were carried out in order to improve the accuracy and reliability of the results. As the spatula is not an apparatus made for measuring, the volume and dimensions of the spatula is not exact and there are no graduation marks on the spatula. Thus, one of the problems encountered was in ensuring that the exact volume of blended potato was scooped and transferred into the test tubes each time. A larger volume of blended potato would have a greater concentration of catalyse. Thus, the blended potato was levelled off first before it is transferred into the test tubes to best ensure that each scoop is of the same volume. For the same reason, the blended potato is scooped by the same person throughout the experiment as human perception and judgment of many things including volume vary between different people.
The blended potato placed in the beaker was covered to prevent air from entering and oxidising the blended potato. Oxidation would affect the catalase enzyme in the potato and thus affect the concentration of enymes used making the results of the experiment less accurate. When reading the scale of the graduated tube during the experiment, the scale was read with eyes directly perpendicular to it to prevent parallax error.
To improve the accuracy of the results, the experiment should have been repeated twice. the average of the three sets readings calculated is more accurate than if the reading was only taken once. When transferring the blended potato into the test tubes, it is noticed some of the blended potato is smeared on the inner surface of the test tube and is unable to be moved down. As a result, the amount of blended potato that reacts with the hydrogen peroxide is lesser than the amount of blended potato scooped initially. This error is due to the small diameter of the test tube thus it is recommended that a boiling tube is used instead. The diameter of the boiling reduces the risk of having blended potato stuck on its sides as the diameter is wide enough for a spatula to enter and push the blended potato down.
Another significant error was that the bung could not have been closed immediately after the hydrogen peroxide is poured into the test tube containing the blended potato. As a result, a large amount of oxygen released by the decomposition of hydrogen peroxide escaped into the surroundings and was failed to be collected during the time taken to fix the bung tightly to the test tube. For this reason, the arrangement of the apparatus could be changed to prevent the oxygen from escaping and thus obtain a more accurate reading of the volume of oxygen collected for each different enzyme concentration. A conical flask should replace the test tube. A bung with two holes of which, one is attached to the delivery tube to the graduated tube. A syringe containing hydrogen peroxide is then inserted into the other hole of the bung and the plunger is pressed to add the hydrogen peroxide to the blended potato in the conical flask. This would lead to more accurate results as only a small amount of air would have been lost and thus has smaller effect on the results obtained.
Safety Precautions:
A lab coat should be worn at all times in the lab to prevent clothes from any stains if any spills occur. Closed shoes should be worn in the lab to provide adequate protection in case of any mishaps. Caution must be applied when handling hydrogen peroxide as it is corrosive due to its high oxidising power. Any spillage on the skin should be washed under running water immediately. Glass wares used in experiment should be handled with care to prevent cracking or breakage as small fragments of glass wares that have been broken are sharp and may cut and cause bleeding.
Conclusion:
It can be concluded that as the enzyme concentration increases, the rate of reaction of a biochemical process increases. The hypothesis is accepted.
References:
Enzyme
-
FULLICK A., 2008. Edexcel AS Biology. China: Pearson
-
GAN W. Y., 2008. Success Biology SPM. Malaysia: Oxford Fajar
-
Image of activation energy. [png] Available at: [Accessed on 17th October 2010]
-
BARNETT G., EGAN J., MASTERS L., SCHMIT A., WATKINS S., WILLIAMSON A., 2008. AS-Level Biology The Revision Guide Exam Board: Edexcel. United Kingdom: Coordination Group Publications
-
Image of mechanism of enzyme activity. [gif] Available at: [Accessed on 17th October 2010]
-
Image of induced-fit hypothesis. [jpeg] Available at: [Accessed on 17th October 2010]
-
Catalase.com. Catalase – An Extraordinary Enzyme! Available at: [Accessed on 17th October 2010]
-
Science-Projects.com. Catalase Kinetics Available at: [Accessed on 17th October 2010]
-
Image of catalase molecule. [png] Available at:
Hydrogen Peroxide
-
WiseGeek.com. Hydrogen Peroxide. Available at: [Accessed on 17th October 2010]
-
Educate-Yourself.org The Many Benefits of Hydrogen Peroxide. Available at: [Accessed on 17th October 2010]
-
Image of hydrogen peroxide molecule. [png] Available at: [Accessed on 17th October 2010]
Buffer Solution
-
ChemGuide.co.uk. Buffer Solution. Available at: [Accessed on 17th October 2010]
FULLICK A., 2008. Edexcel AS Biology. China: Pearson
GAN W. Y., 2008. Success Biology SPM. Malaysia: Oxford Fajar
Image of activation energy. [png] Available at: [Accessed on 17th October 2010]
BARNETT G., EGAN J., MASTERS L., SCHMIT A., WATKINS S., WILLIAMSON A., 2008. AS-Level Biology The Revision Guide Exam Board: Edexcel. United Kingdom: Coordination Group Publications
Image of mechanism of enzyme activity. [gif] Available at: [Accessed on 17th October 2010]
Image of induced-fit hypothesis. [jpeg] Available at: [Accessed on 17th October 2010]
Catalase.com. Catalase – An Extraordinary Enzyme! Available at: [Accessed on 17th October 2010]
Science-Projects.com. Catalase Kinetics Available at: [Accessed on 17th October 2010]
Image of catalase molecule. [png] Available at:
WiseGeek.com. Hydrogen Peroxide. Available at: [Accessed on 17th October 2010]
Educate-Yourself.org The Many Benefits of Hydrogen Peroxide. Available at: [Accessed on 17th October 2010]
Image of hydrogen peroxide molecule. [png] Available at: [Accessed on 17th October 2010]
ChemGuide.co.uk. Buffer Solution. Available at: [Accessed on 17th October 2010]