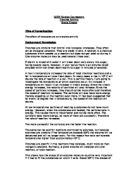
While enzymes do lower the activation energy of reactions, the rate at which they do this depends on many factors. Temperature is one of the factors that determines at what rate enzymes will catalyze reactions. All enzymes have a temperature range at which they catalyze the most reactions. Also at either end of the temperature spectrum, enzymes will cease to work. Enzymes are held together by a combination of Hydrogen Bonds, Hydrophobic interactions, and Vander wall interactions. These weak, non-covalent interactions can only hold enzymes together under very specific environmental conditions (temperature, PH, salt concentration). As any or all of these conditions become too harsh, the non-covalent bonds which hold the enzyme together are no longer able to do so. At the coldest temperatures, enzymes will not work because the particles in a specific solution would not move, and therefore the enzymes will not come in contact with any substrates with which to react. At the hottest temperatures the weak non-covalent bonds are not strong enough to hold the high energy components of the enzyme together.
This experiment, while important is in no way groundbreaking. The data collected will not surprise anybody, but it will help to reinforce the conclusion that temperature effects enzyme activity in the way that at extremes of temperature enzymes will not work, and somewhere in between the lack of activity will be the ideal temp for each specific enzyme. Also this experiment will help the class learn firsthand how temperature, and all the other factors that effect enzyme activity, actually do.
Each section of the experiment had a specific purpose, to aid in the formulation of a conclusion. The goal was to test the effect of temperature on enzyme activity. To test this, 5 test tubes were heated at temperatures at 10 degree intervals between 10 and 60 degrees Celsius, four with all the solutions present, and one constant with everything except the enzyme. The purpose of the control was to determine the color change (absorption rate) of the sucrose solution compared to a test tube without any enzyme. In case there was a change in color even without the enzyme, the control would determine how much change was due to enzyme activity, and how much was unrelated. After the heating at each specific temp for 20 minutes, DNS was added. The purpose of DNS was to stop the reaction and provide data for how much enzyme activity took place. The DNS reacted with the glucose, and the solution with DNS would change color depending on how much sucrose was separated into glucose and fructose. The more enzyme activity the darker the color, and the darker the color the more light would be absorbed by the test tube while in the spectrophotometer. Without the DNS one would not be able to tell with such accuracy just how active the enzyme Invertase was. The test tubes were placed in boiling water when the DNS was added to speed up the particles and to make sure everything that could react, did.
Methods and Materials
Initially, fairly large beakers containing tap water were heated to temperatures between 10 and 60 degrees Celsius at 10 degree intervals. When the water in these beakers reached the desired temperature, using whatever method necessary, the water was manipulated to stay at the temperature for as long as necessary, at least 30 minutes. After the desired temp was reached, 5 test tubes for each temperature were prepared, and each test set of test tubes was numbered 1-4, and B. All 5 test tubes were initially filled with .5ML of the sucrose substrate, and .5ML of the buffer. After that four of the test tubes had .5ML Invertase added, while the other had .5ML of distilled water added. Once all the necessary solutions had been added, the set of 5 test tubes, (one control and four with enzyme) for each temperature level were added to the temperature specific bath. The test tubes were placed in the bath in such a way that the test tubes would rest inside the beaker, with the heated or cooled water effecting the temperature inside the beaker. However there would be no contact between the heated water and the solutions inside the test tube. For the next 20 minutes each set of 5 test tubes was kept inside each temperature specific beaker, with the necessary adjustments being made to assure steadiness of temperature. When 20 minutes was up, each set of 5 test tubes was removed, and separated to avoid confusion of data. After the beakers were taken out, 1ML of DNS was added to each test tube in each temperature, then the tubes were covered with aluminum foil, and finally all the test tubes were placed in a beaker with boiling water for 10 minutes. After 10 minutes all the test tubes were removed from the boiling water bath. Next .5ML of distilled water was added to each beaker, then aluminum foil was placed over the top, and finally each test tube was cooled under cold water. After all the test tubes were cooled, each set of 5 was separated and prepared for the spectrophotometer. For each temperature level the following description is the same. The OD was set to 540 nm, and then the temperature blank was used to then set the transmission percentage. Then the four test tubes that contained the enzyme were placed in the Spectrophotometer and their values were compared with the blank test tube. The transmission for each of the four variable tubes was averaged to obtain an average for each temperature value. Finally a graph was made using the given data. The data obtained in the experiment was then compared with the best fit line of the graph of the given data, and the rate of enzyme activity for each temperature was calculated. Using the calculated data, a new graph was made with temperature and rate and the X and Y axis, to show visually the effect of temperature of enzyme activity. Used in this experiment were 6 large beakers, for the heating and cooling of the temperature baths. Also used were a few small beakers to hold the sucrose solution, the buffer, and the Invertase. To hold the 4 variable solutions and the one control for each temp value, 30 regular test tubes were used. To heat the large beakers two electrically powered burners were employed. To write on the test tubes the groups used wax pencils, and finally to accurately measure amounts of each solution syringes were used.
Results
The table below shows the initial absorbency levels and the average of each of the four variable test tubes compared to the control test tube, for each temperature level.
Light absorbency values for each temperature
The table below shows the average absorbance, the µM of fructose and glucose produced, the µM produced of just sucrose, and finally the µM of sucrose produced per minute. The µM produced was determined using the best fit line with the given data. The graph that contains the best fit line graphed from the given data is attached at the end of the report. From there that number was divided by two to determine the initial amount of sucrose, and then that number divided by the number of minutes, 20, to determine the rate of µM sucrose produced per minute.
Sucrose and Solution absorbency rates for each temperature level.
The graph below shows the rate of sucrose absorbency per minute, compared with the temperature. This shows that the rate of absorbency increases until about 50 degrees, where it begins to decline
Discussion
It is clear that the results support the conclusion that temperature affects the rate of enzyme activity. The data supports the statement that as the temperature level increases from 10 degrees Celsius to somewhere between 40 degrees Celsius and 50 degrees Celsius so does enzyme activity. And that after the peak between 40 degrees Celsius and 50 degrees Celsius the rate of enzyme activity begins to decrease. As the temperature increases from 10 degrees Celsius to the peak temp the movement of substrate particles increases. As the movement of substrate increases the likelihood that the substrate will come in contact with the enzyme also increases. This is true until a certain level however. As the particles move faster, the parts of the enzyme begin to push and pull in different directions. The increased temperature increases particle movement in the environment and in a molecule. As the parts of the enzyme move faster, at some point the weak non-covalent bonds are no longer able to hold the enzyme together, and it becomes denatured. As the bonds break the enzyme no longer holds its active site to a specific shape, and when the active site lacks a specific shape it is no longer able to hold out H20, it is no longer to promote acid base reactions, and most importantly it is not able to hold on to a substrate. The results obtained in this experiment match previously recorded data from similar experiments, and matches conclusions drawn in many sources, including the AP Biology text book. The data supports the conclusion that as temperature increases, so does enzyme activity, until a certain point, where the enzyme begins to denature and will eventually not function at all. All the information listed above in different sections, including the graph and the basic information provided in the introduction supports these conclusions.
Conclusion
In conclusion, it is clear that temperature has an important effect on enzyme activity. It is also clear that enzymes are more productive at some temperatures than at others. Starting at 10 degrees Celsius Invertase was not that active. The amount of Invertase activity increased until it peaked at 50 degrees Celsius, and then declined at 60 degrees Celsius. From the data it is clear that the optimum temperature for Invertase activity is between 40 degrees Celsius and 50 degrees Celsius. To sum it all up, the activity of Invertase depends a lot on temperature, and with a temp that is too low or too high, there would be little or no sucrose breakdown.